Weekly Market Update: Tech Stumbles, but the Broader Market Holds Steady
Markets finished the week mixed as leadership continued to rotate beneath the surface.
The S&P 500 slipped -0.1%, while the Nasdaq declined -2.5% as investors moved away from Technology stocks. However, the weakness in the major indexes didn’t tell the full story.
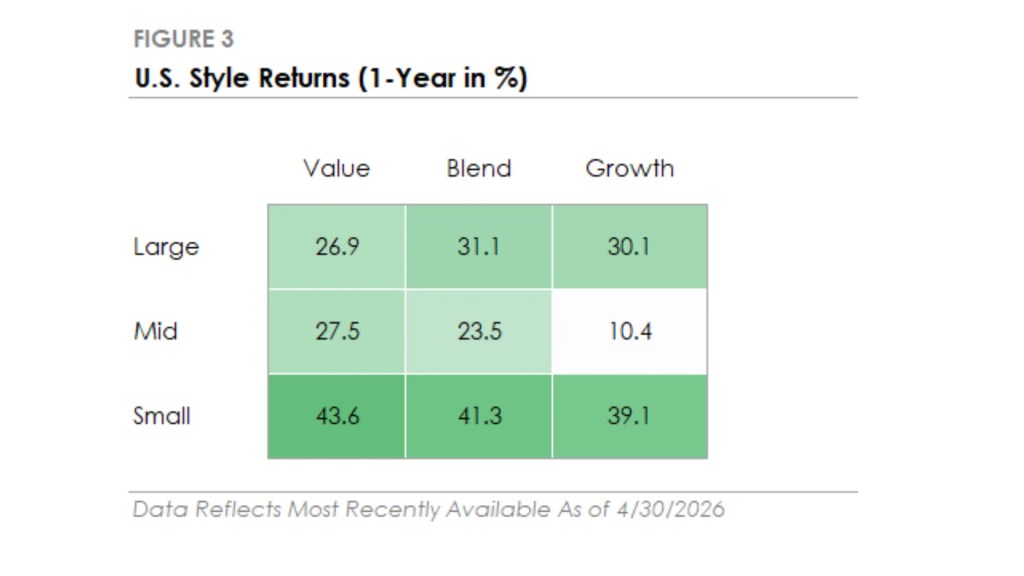
Both value stocks and the equal-weighted S&P 500 outperformed, which suggests that the average stock held up better than the largest companies driving the headline indexes. Meanwhile, high-beta and momentum stocks led the market lower because of their heavy exposure to Technology, which declined -4.3% for the week.
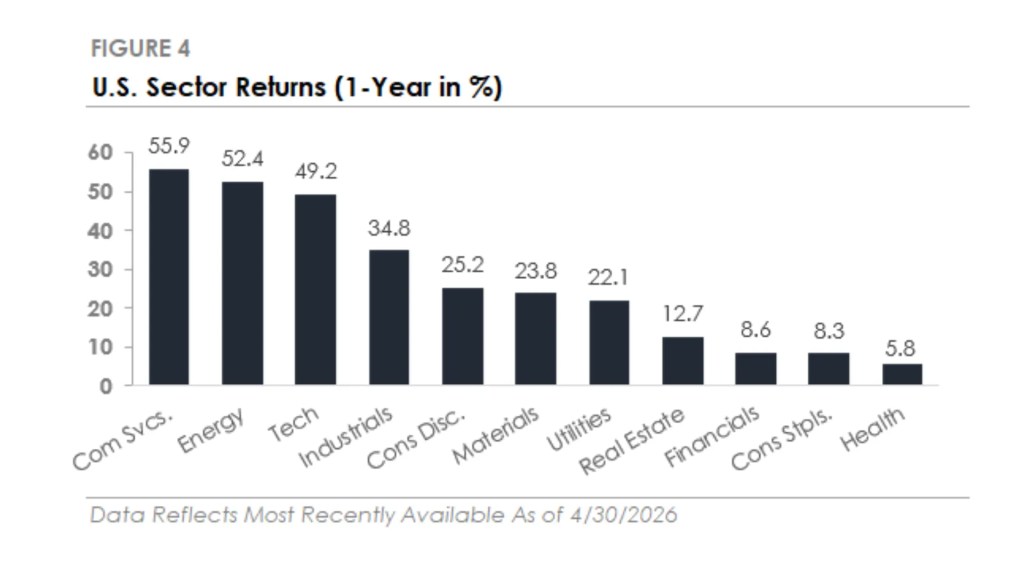
Even so, eight of the eleven S&P 500 sectors finished higher, led by Energy and Consumer Staples. That broader participation helped offset some of the weakness in Technology.
Bonds were mostly unchanged. However, longer-dated Treasury bonds modestly underperformed as oil prices surged nearly +10% following renewed conflict in the Middle East.
Elsewhere, the VIX, a measure of expected market volatility, held steady. The U.S. dollar was little changed, while Bitcoin gained +1.0%.
Key Takeaways
Inflation Cooled Sharply in June as Energy Prices Fell
Consumer inflation declined sharply in June.
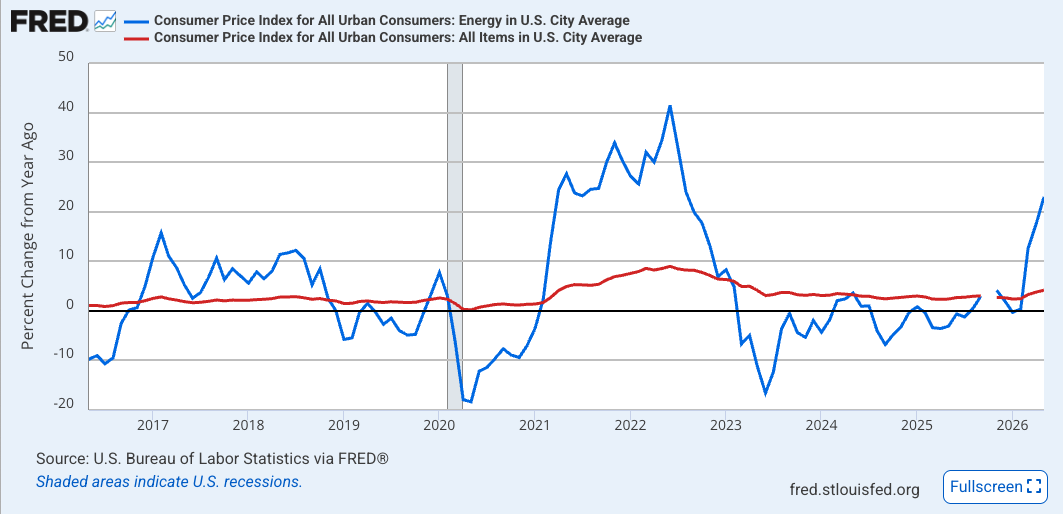
The Consumer Price Index, or CPI, fell -0.4% for the month, marking its largest monthly decline in more than six years. As a result, the annual inflation rate slowed to +3.5% from +4.2% in May.
Wholesale inflation eased as well, suggesting that some price pressures were moderating before reaching consumers.
However, much of the improvement came from energy. Gasoline prices declined nearly -10%, which pulled down both consumer prices and wholesale costs.
That distinction matters because June’s report reflects a period when oil prices were falling and were significantly lower than they are today. Since the beginning of July, the U.S.-Iran ceasefire has broken down, and crude oil has climbed back toward $80 per barrel after starting the month below $70.
Why it matters: June’s inflation improvement was real, but it depended heavily on lower energy prices that have already begun to reverse. With inflation still above the Federal Reserve’s 2% target and oil prices climbing again, the central bank has signaled that it may need to raise interest rates.
Wall Street Banks Reported Strong Second-Quarter Earnings
Wall Street banks benefited from a busy and volatile second quarter.
Banks earn fees when companies issue debt or stock, complete mergers, go public, or increase their trading activity. During the second quarter, all of those areas were active.
A wave of dealmaking and initial public offerings, including the roughly $75 billion SpaceX debut, helped drive investment banking revenue higher. At the same time, market volatility tied to the Middle East conflict and the continued AI boom supported trading revenue.
AI-related financing added another source of activity. Companies continued raising debt and equity to fund the construction of data centers and other infrastructure needed to support AI development.
As a result, Goldman Sachs reported the strongest quarter in its history. JPMorgan Chase, the nation’s largest bank, increased earnings by more than +40% compared with the same period a year ago.
Why it matters: The same active and volatile market environment that created uncertainty for investors worked in the banks’ favor. When companies raise capital and investors trade more frequently, banking fees and trading revenue tend to rise.
The Broader Market Held Steady as Technology Turned Volatile
Semiconductor stocks continued to experience sharp day-to-day swings as investors questioned the pace, cost, and potential payoff of the AI buildout.
However, that volatility hasn’t spread across the broader market.
Instead, market leadership has rotated. As investors reduced exposure to chipmakers and other Technology stocks, they moved into areas such as Financials, Industrials, Energy, and Consumer Staples.
Because of that rotation, the S&P 500 remains within 1% of its early June record despite the recent weakness in Technology.
There are also few signs of broader financial stress. The VIX remains in the mid-teens, while credit markets have stayed calm and credit spreads remain extremely tight.
Why it matters: This year’s most popular trade has become more volatile, but the weakness hasn’t pulled the entire market lower. Other sectors have begun to participate, helping offset the decline in semiconductor and Technology stocks.
Consumer Spending Continued to Rise in June
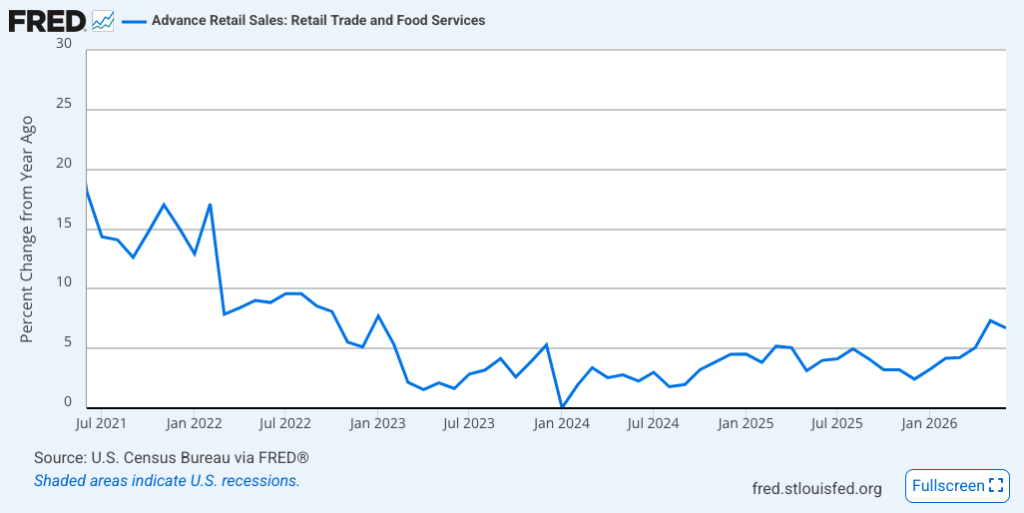
Retail sales increased +0.2% in June. That was slower than May’s revised +1.0% gain, but it was in line with expectations.
Once again, energy prices played an important role.
Lower gasoline prices reduced sales at gas stations, which weighed on the headline retail sales figure. However, those same lower energy costs also helped ease inflation and left consumers with more money to spend elsewhere.
Excluding gasoline, retail sales increased +0.7%. Online shopping contributed to the gain as consumers took advantage of promotions surrounding Amazon’s Prime Day.
Why it matters: Consumer spending drives most of the U.S. economy. June’s report suggests that spending is continuing to hold up rather than stall, particularly once the effect of lower gasoline prices is removed.
Weekly Market Update: Markets Pull Back as Oil Keeps Inflation in Focus
Markets fell for a second straight week, pausing the nearly two-month rally that began in late March. The market’s recent winners, especially technology, semiconductors, and growth stocks, continued to lead the decline. Weakness in mega-cap tech weighed on the S&P 500 and Nasdaq, while small caps, value stocks, and the equal-weight S&P 500 held up better.
The rotation was notable. Defensive sectors led the week, and ten of the eleven S&P 500 sectors outperformed the index. That marked a reversal from recent weeks, when technology drove most of the market’s gains.
Treasury yields ended the week lower as oil prices fell on headlines pointing toward a possible diplomatic resolution, even though headline inflation came in hotter than expected. Bonds traded higher as yields declined, with longer-maturity bonds outperforming. Commodities moved lower as oil fell more than 6%, while bitcoin stabilized after falling toward $60,000 last week.
The week’s market action was less about something breaking and more about markets digesting a rally that had become increasingly narrow. The same areas that carried stocks higher are now creating most of the pressure. That does not make the pullback unusual, but it does make the market more sensitive to changes in sentiment around technology, oil, inflation, and the Fed.
The central question heading into next week is whether this remains a normal pullback after record highs, or whether higher oil prices and renewed inflation pressure force markets to rethink the path of interest rates.
Key Takeaways
A Pullback After Record Highs
The S&P 500 and Nasdaq opened June at fresh record highs, but both have given back roughly 5% over the past few weeks. Technology and semiconductor stocks have led both the recent rally and this month’s pullback, which makes the decline feel sharper at the index level than it does beneath the surface.
There are still signs of rotation rather than broad breakdown. Small caps, value stocks, and the equal-weight S&P 500 held up better, and market breadth has remained steady.
Why it matters: Pullbacks after record highs are normal and do not mean something is broken. But they are a reminder that concentrated leadership cuts both ways. The same areas that help the market on the way up can create pressure when sentiment turns.
Inflation Was Hot, But Mostly Because of Energy
Inflation climbed to a three-year high in May. Consumer prices rose 4.2% year-over-year, up from 3.8% in April, with energy accounting for more than 60% of the monthly increase. Gasoline rose about 7% during the month and roughly 40% over the past year.
The details underneath the headline were calmer. Core inflation, which excludes food and energy, slowed to 2.9% and rose just 0.2% month-over-month, slightly below expectations. Shelter inflation, one of the larger and stickier parts of the inflation basket, also continues to ease.
Why it matters: Inflation remains above the Fed’s target, but the source of the pressure matters. For now, the spike appears concentrated in fuel. The risk is that higher energy prices eventually spread into broader prices, wages, and expectations.
The Labor Market Is Still Growing, But Not Without Soft Spots
Employers added 172,000 jobs in May, more than double expectations, and the unemployment rate held steady at 4.3%. Hiring for the prior two months was revised higher by a combined 93,000 jobs.
That is a better headline than markets expected. But the labor market is not sending an entirely clean signal. Job gains were concentrated in a handful of industries, long-term unemployment remains elevated compared to a year ago, and wage growth cooled to 3.4% year-over-year.
Why it matters: The economy continues to improve after slowing in late 2025, but the data are not one-sided. The Fed has to balance a labor market that is still expanding against inflation that remains above target.
Oil Remains the Swing Factor
Oil and the Iran conflict remain the thread running through this week’s market story. Renewed military strikes and ongoing shipping disruptions in the Strait of Hormuz have kept energy prices elevated, even though oil remains below its spring peak.
The latest strikes spared energy infrastructure, which helped prevent a larger move higher, but oil remains near $90 per barrel and well above where it traded a year ago.
Why it matters: Oil is the main force pushing headline inflation higher, and it is also the variable that could pull inflation lower if tensions ease. The longer the Strait of Hormuz remains disrupted, the more pressure it puts on inflation, interest rates, and market sentiment.
The Fed Has Less Room to Maneuver
The Fed meets next week for its first meeting chaired by Kevin Warsh. Markets expect the Fed to hold rates steady at both the June and July meetings, but this week’s inflation data and the continued Middle East conflict have reshaped the outlook for later this year.
A few weeks ago, the question was when the Fed might cut rates. Now, markets are paying more attention to whether the Fed may need to raise rates again if inflation pressure persists. The market is leaning toward a potential rate increase in the fourth quarter, especially if oil prices stay elevated.
Why it matters: Interest rate expectations affect mortgages, savings yields, bond prices, stock valuations, and the broader planning environment. The Fed’s decision next week may be uneventful, but its tone and outlook could set the market’s direction for the coming months.
Weekly Market Update: May's Record Rally Runs on a Short Leash
May was a month of records, though the rally's foundation was narrower than the headlines suggested. The S&P 500, Nasdaq, Dow, and Russell 2000 all set new all-time highs, powered almost entirely by technology and semiconductor stocks. The gains came despite a genuine rate scare: back-to-back hot inflation readings put a Federal Reserve rate hike back on the table and pushed long-term Treasury yields sharply higher. The pressure faded when oil prices fell more than 13%, taking inflation fears with them and clearing the way for the AI trade to reassert itself.
Beneath the surface, the picture was more complicated. Technology gained nearly 20% on the month; strip it out, and the remaining sectors were slightly negative in aggregate. Only three of the eleven sectors finished higher. Bond markets reflected the same tension, with shorter-term yields rising while longer maturities ended roughly flat. In credit, spreads generally tightened, though the riskiest tier of high-yield bonds diverged and widened. Oil fell 13.2% as the geopolitical risk premium unwound, dragging the broader commodity complex down more than 5%. Corporate earnings offered a bright spot: first-quarter blended growth came in at 28.6% against a 13.1% estimate, with profit margins reaching a record 14.8%. But like the rally itself, the earnings strength was concentrated in a handful of large semiconductor and mega-cap names.
The month also brought a change at the Federal Reserve. Jerome Powell's term expired in mid-May, and Kevin Warsh was confirmed as the new chair. Warsh inherits a complicated environment: the base case points to a rate hike by December if the Strait of Hormuz disruption keeps oil prices elevated, the administration has expressed a preference for lower rates, and inflation remains above the 2% target. Markets will need to adjust to a new communication style just as the Fed's independence faces heightened scrutiny.
The economic backdrop offers a similarly mixed read. The labor market has firmed after softening last fall, and manufacturing has returned to expansion territory. The consumer, however, is moving the other way, with income growth slowing and confidence near record lows by some measures. What has kept households spending is balance-sheet strength from elevated home values and a rising stock market. That support, as long as it holds, keeps the expansion intact. Whether it holds is the central question heading into the summer.
Key Takeaways
Records Built on Narrow Leadership
May's market gains were real, but the breadth underlying them was not. Technology accounted for nearly all of the S&P 500's advance, and most sectors finished negative. The Dow, Russell 2000, and equal-weight S&P each returned between 2% and 3%, a fraction of the Nasdaq's performance. Momentum and high-beta factors led; defensive and dividend-oriented stocks lagged.
Why it matters: An index sitting at all-time highs on such concentrated leadership is more fragile than the scoreboard implies. Any shift in sentiment around AI and semiconductors would leave most of the market without a catalyst to offset the pressure.
Oil Was the Swing Factor
WTI crude fell 13.2% in May as the geopolitical risk premium tied to the Strait of Hormuz unwound. That decline did the critical work of easing inflation pressure mid-month, pulling Treasury yields lower and giving equities room to recover. The broader commodity complex fell more than 5% in sympathy.
Why it matters: The rally's trajectory is directly tied to oil. The Strait of Hormuz remains functionally closed, and the physical supply disruption is unresolved. If oil prices move higher again, the inflation and rate-hike risk that rattled markets mid-month returns with it.
A New Fed Chair Adds Policy Uncertainty
Kevin Warsh replaced Jerome Powell as Federal Reserve chair in mid-May, inheriting an environment with inflation above target, a December rate hike increasingly priced in, and an administration publicly favoring lower rates. Futures markets, which began the year expecting cuts, now assign meaningful odds to a hike by year-end.
Why it matters: A leadership transition at the Fed introduces communication uncertainty at a moment when policy expectations are already shifting. Markets priced in cuts and got a possible hike. How Warsh navigates that gap, and the political pressure that surrounds it, will shape rate expectations for the remainder of the year.
Earnings Growth Is Strong but Concentrated
First-quarter blended earnings growth came in at 28.6%, well above the 13.1% estimate entering the quarter, with profit margins reaching a record 14.8%. Analysts have continued to raise forecasts, with upgrades outpacing downgrades by roughly two and a half to one.
Why it matters: Strip out the largest semiconductor names and technology's growth rate is cut roughly in half. The same concentration that defines the price rally defines the earnings beneath it. As estimates keep rising, the bar future quarters must clear keeps rising with them.
The Consumer Is the Key Risk to Watch
The labor market has firmed and manufacturing has returned to expansion, but consumer confidence is near a record low by at least one closely watched measure, and income growth continues to slow. Households have stayed spending largely because elevated home values and a rising stock market support balance-sheet health.
Why it matters: Several years of consumer-led growth have kept the expansion intact. If the asset-price support that underlies household spending begins to weaken, reduced consumer outlays could translate into slower economic growth at the same moment the Fed may be tightening rather than easing.

Markets Found Their Footing, But Leadership Remained Narrow
May was a strong month for markets.
The S&P 500 gained 5.3% and set multiple new all-time highs. The Nasdaq 100, Dow Jones Industrial Average, Russell 2000, and even the equal-weighted S&P 500 also reached new highs during the month.
On the surface, that sounds like a broad and healthy rally.
And in some ways, it was.

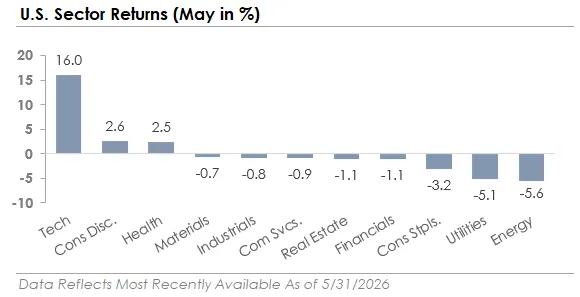
But when you look underneath the surface, the story becomes more nuanced. Technology stocks led the market by a wide margin, gaining 16% during the month. Consumer Discretionary and Health Care also moved higher, but eight of the eleven S&P 500 sectors declined.
That means the index made new highs while most sectors moved lower.
This is one of the more important details from May. The market was strong, but leadership remained concentrated. Large-cap growth stocks continued to outperform large-cap value stocks, and companies tied to artificial intelligence remained at the center of investor attention.
In plain English, the market continued to reward the companies viewed as the biggest beneficiaries of the AI buildout, while more traditional and cyclical areas of the market lagged behind.
That doesn’t mean the rally is unhealthy. It does mean investors should be careful not to confuse a rising index with a fully broad-based market.

Bonds Held Up Despite Higher Rates
Bonds also moved higher in May, although the story there was more complicated.
The U.S. Aggregate Bond Index gained 0.3%, while investment-grade and high-yield corporate bonds performed slightly better. Corporate bonds benefited as credit spreads tightened, which means investors were willing to accept less additional yield to own corporate debt instead of Treasury bonds.
That’s usually a sign that investors are still relatively comfortable taking risk.
At the same time, Treasury yields moved higher during the month. The 30-year Treasury yield briefly moved above 5%, reaching levels last seen in 2007, while the 10-year Treasury yield reached a new 52-week high.

The move in rates was driven by renewed inflation concerns. Hotter-than-expected consumer and producer price reports, combined with elevated oil prices, pushed investors to rethink the path of Federal Reserve policy.
Earlier in the year, markets were still leaning toward rate cuts. By the end of May, expectations had shifted meaningfully, with the market assigning a greater than 50% probability to a Fed rate hike at the December 2026 meeting.
That’s a notable change.
For investors, the message is straightforward. The bond market is still trying to adjust to the possibility that interest rates may stay higher for longer. That doesn’t mean bonds have lost their role in a portfolio. But it does mean the path back to lower rates may be less direct than investors hoped.
The Two Themes Driving Markets
Two themes continue to shape the market environment this year.
The first is geopolitics.
Earlier in the year, investors were focused on trade policy and tariff uncertainty. More recently, the focus has shifted to the conflict in the Middle East and the resulting disruption in global oil markets.
The Strait of Hormuz, which carries roughly 20% of global oil supply, has been effectively closed since the conflict began in late February. That disruption has reduced global oil inventories and kept energy prices elevated.
Oil prices have remained high, although they’ve been more contained than many investors might have expected given the scale of the disruption. In May, there was some relief as U.S.-Iran negotiations progressed and markets began pricing in the possibility that the Strait could eventually reopen. West Texas Intermediate crude ended the month below $90 per barrel, down 16.5%.
That was encouraging.
But it doesn’t fully resolve the uncertainty.
Even if a deal is reached, it would likely take months for shipping traffic to normalize. Until then, the Middle East remains a key source of risk for energy prices, inflation, interest rates, and broader market sentiment.
The second theme is artificial intelligence.
The AI buildout is no longer just a technology story. It has become an economic story, an earnings story, and a market leadership story.
The largest technology companies are committing hundreds of billions of dollars to build the physical infrastructure needed for artificial intelligence. That includes data centers, computer chips, power generation, and the broader systems required to support growing AI demand.
Forecasted 2026 capital spending across the leading technology companies now exceeds $600 billion, with much of that spending tied to AI infrastructure.
That level of investment is meaningful.
It is helping drive economic activity. It is showing up in corporate earnings. And it is creating a wide gap between companies connected to the AI buildout and companies that are not.
This explains much of the performance difference we saw in May. Technology stocks didn’t just outperform because investors were excited about the future. They outperformed because the market is starting to see the real financial impact of AI spending.
At the same time, this kind of rapid change creates risks.
Supply chains can become stretched. Expectations can move too far ahead of reality. And when market leadership becomes concentrated in a small group of companies, investor portfolios can become more dependent on a narrow part of the market than they realize.
That’s not a reason to avoid technology or artificial intelligence. But it is a reason to remain disciplined.
What This Means for Investors
May was a good reminder that markets can feel reassuring and uneven at the same time.
The major indexes made new highs. Corporate bonds held up. Credit markets remained stable. And investors continued to reward companies tied to the AI buildout.
But there were also signs of caution beneath the surface.
Most S&P 500 sectors declined. Treasury yields moved higher. Inflation concerns reemerged. Oil prices remained tied to geopolitical uncertainty. And market leadership continued to depend heavily on technology.
For long-term investors, the lesson isn’t to predict which theme will dominate next month.
The lesson is to stay grounded.
Markets are always telling more than one story at a time. Right now, one story is about resilience, innovation, and strong corporate earnings. Another story is about concentration, geopolitical risk, inflation pressure, and higher interest rates.
Both can be true.
That’s why portfolio discipline matters. A thoughtful investment plan should allow you to participate when markets move higher, while also helping you avoid becoming overly dependent on any single theme, sector, or outcome.
May was a strong month. But the strength was not evenly distributed.
And that’s the part investors should remember.


Weekly Market Update: Stocks Set New Records as Oil Pulls Back and Rates Ease
Stocks continued their climb through a holiday-shortened week, with the major indexes setting fresh records along the way. The S&P 500, Nasdaq, and Dow each closed at new all-time highs, and the rally showed signs of widening beyond the largest technology companies. Small-cap stocks and the equal-weight S&P 500 participated more meaningfully than they had in recent weeks.
Technology remained the strongest sector, helping lift both the market-cap-weighted index and growth stocks higher. Defensive sectors and energy lagged as investors responded to signs of diplomatic progress in the Middle East. Oil prices moved lower, which helped Treasury yields reverse some of their recent climb. That decline in rates offered relief to bonds and other rate-sensitive areas of the market. Volatility also eased, with the VIX drifting lower as geopolitical concerns cooled and stocks moved higher.
Key Takeaways
Inflation Remains Elevated, But the Pace of Price Increases Eased Last Month
The April PCE price index, the Fed’s preferred inflation measure, rose +3.8% year-over-year, its highest reading since May 2023. However, the monthly increase of +0.4% came in below the +0.5% forecast and slowed from March’s +0.7% increase. Much of the pressure in the headline number was tied to energy prices following the ongoing Strait of Hormuz oil disruption.
Core PCE, which excludes food and energy, rose just +0.2% for the month, below the +0.3% consensus estimate. On a year-over-year basis, core inflation edged up from +3.2% to +3.3%.
Why it matters: The energy shock is still showing up in the annual inflation data, but the softer monthly core reading suggests that price pressures have not yet broadened across the economy. Investors will be watching upcoming inflation reports closely for signs that higher energy costs are beginning to spill over into other areas.
Economic Growth in Q1 Was Slower Than Initially Estimated
The second estimate of first-quarter GDP was revised lower to a +1.6% annualized pace, down from the initial +2% reading. The downgrade arrived the same morning as the hotter inflation report, underscoring the tension between slower growth and still-elevated prices.
Why it matters: Growth rebounded in Q1 following the Q4 government shutdown, but the combination of slower growth and elevated inflation raises the possibility of a more challenging backdrop. That type of environment would make the Fed’s job more difficult, because cutting rates to support growth could risk putting additional pressure on inflation.
Major Stock Indexes Continued to Set New Highs This Week
The Dow, S&P 500, and Nasdaq each reached new records, extending the rally that began in late March. Importantly, the gains were not limited to the largest technology companies. Small-cap stocks and the equal-weight S&P 500 also moved to new highs.
Why it matters: Large technology stocks have carried much of the market’s advance since late March, and market breadth has been uneven at times. This week’s broader participation from the Dow, small caps, and the average S&P 500 stock is a constructive sign that the rally is becoming less dependent on a narrow group of companies.
Middle East Headlines Continue to Drive Oil Prices and Impact Market Sentiment
Iran reported a preliminary agreement to extend the ceasefire and guarantee shipping through the Strait of Hormuz, briefly sparking a risk-on move before U.S. officials disputed the document. Later in the week, renewed ceasefire headlines helped push stocks toward new all-time highs.
Oil prices pulled back over the week, with crude trading near $90 and on pace for a second consecutive weekly decline as markets priced in the possibility of an eventual agreement.
Why it matters: The Strait of Hormuz remains the biggest wildcard for energy prices and, by extension, inflation. A genuine resolution would be a meaningful positive for both markets and consumers. However, this week’s back-and-forth is a reminder that the headlines remain volatile and the outcome is still uncertain.
Interest Rates Reversed Lower as Oil Prices Declined
Treasury yields had climbed sharply in recent weeks, with the 30-year yield reaching a two-decade high as the oil price spike raised inflation concerns. That pressure eased this week as crude prices moved lower. The 10-year Treasury yield fell to around 4.45%, while the 30-year yield dropped back below 5.00%.
The move reflected the broader shift in Middle East sentiment. Reported progress toward reopening the Strait of Hormuz pulled oil prices lower, which also reduced some of the inflation premium that had been built into bond yields.
Why it matters: The recent path of interest rates has been closely tied to oil prices and developments in the Middle East. This week’s reversal provided some relief for bonds, mortgages, and other rate-sensitive parts of the market. Whether that relief lasts will likely depend on whether oil prices remain contained and diplomatic progress continues.

Weekly Market Update: Hot Inflation Tests a Narrow Rally
Markets traded higher for a seventh consecutive week, extending the rally that began in late March. The S&P 500 and Nasdaq set new all-time highs, but the rally remained narrow.
Small-cap stocks and the equal weight S&P 500 produced only modest gains, with technology again the strongest sector and the largest tech names pulling the broader index and growth factor higher.
The week's defining story was inflation. Both consumer and producer prices rose at the fastest pace in years, and Treasury yields climbed across the curve in response. Corporate bonds outperformed as credit spreads tightened, while oil prices moved higher on renewed Middle East tensions.
International stocks once again lagged U.S. stocks. Next week's big event is Nvidia's earnings report, which will provide more insight into AI capex spending.
Key Takeaways
Inflation Came in Hot at Both the Consumer and Wholesale Level
Consumer prices rose +3.8% year-over-year in April, the highest reading in nearly three years. Wholesale prices delivered the bigger surprise at +6.0% y/y, the largest annual gain since December 2022.
The two reports measure inflation at different points in the supply chain (wholesale captures what businesses pay, while consumer prices capture what households pay), and a hot wholesale print signals the potential for more inflation pass-through. Higher gas prices drove a large share of both increases, but the rise wasn't limited to energy, with service categories like airfare, hotels, and rent also rising.
Why it matters: The inflation that's been building in energy markets is now showing up in the broader data, and the pressure is spreading beyond energy.
Oil Prices Rose as U.S.-Iran Tensions Re-Escalated
Oil rose more than +5%, with most of the move coming Monday after President Trump told reporters the Iranian ceasefire was "on life support." Energy was the second-best-performing sector of the week.
Gasoline prices remain near $4.50 a gallon nationally, and the White House floated suspending the federal gas tax, an acknowledgment that pump prices have become a political concern.
Why it matters: The supply side of the inflation story remains unresolved. The longer oil stays elevated, the more the cost shows up in everyday spending categories like fuel, food, and transportation.
Interest Rates Rose as Investors Absorbed the Inflation Data
Treasury yields rose across the yield curve, including longer-term yields, which was notable. The move higher in long-term yields suggests the market expects inflation to remain elevated, with the 30-year yield rising above 5%.
Shorter-term rates also rose, an indication the market believes persistent inflation could pressure the Fed to raise interest rates. In related news, the Senate confirmed Kevin Warsh as the next Fed chair by the slimmest margin in modern history, with his first meeting in June.
Why it matters: Futures markets price in zero rate cuts for the rest of 2026, with consensus shifting toward interest rates staying higher for longer.
Major Indexes Set New Highs Despite a Narrow Rally
The S&P 500 and Nasdaq both closed at new all-time highs, gaining more than +2% each. Most of the move came Wednesday on the start of a Trump-Xi summit in Beijing and strong gains in mega-cap tech, with Apple crossing $300 a share for the first time.
Beneath the index level, small-cap stocks and the equal weight factor produced modest gains. Sector leadership rotated as well, with energy and defensive areas like healthcare and consumer staples rising while financials and industrials declined.
Why it matters: The major indexes continue to set new highs, but the broader market paused this week. The divergence doesn't necessarily break the rally's longer trend, but it's worth watching as the inflation and interest rate situation develops.
Consumers Continue to Spend Despite Rising Energy Costs
April retail sales beat expectations, growing +4.9% year-over-year. Excluding autos and fuel, the categories most affected by inflation, spending rose +0.5% month-over-month.
Why it matters: April's retail sales data suggests consumer spending is holding up despite rising energy costs. If spending slows under the weight of higher prices, it could translate into slower economic growth.

Weekly Market Update: Rally Extends to Six Weeks as Iran Talks Advance
Markets traded higher for a sixth consecutive week, extending the rally that began in late March and pushing several major indexes to new highs.
Technology and growth stocks led the advance, with the Nasdaq gaining nearly 4%, outpacing the S&P 500 and small-cap stocks, which each rose roughly 1.5%. Technology, consumer discretionary, and communication services were the top-performing sectors, all of which carry significant exposure to the largest companies in the market.
Beneath the surface, the picture was more mixed. Six of eleven sectors finished the week lower, highlighting how the rally has been driven by a relatively narrow group of market leaders. Bonds produced modest gains as interest rates drifted lower, and oil fell more than 8% on reports of progress toward an Iran deal.
The week closed with a stronger-than-expected April jobs report, adding to the picture of an economy that continues to hold up despite the geopolitical backdrop.
Key Takeaways
The Middle East Conflict, Now in its 10th Week, Remains the Top Story in Financial Markets
The week opened with Iran's most serious provocation since the April ceasefire, including strikes on the UAE and attacks on commercial ships in the Strait of Hormuz. The tone shifted quickly as regional allies pressed for de-escalation and reports emerged of a framework agreement to end the conflict.
Oil fell nearly 10% early in the week, trading near $90 per barrel for the first time since mid-April.
Why it matters: The acute market stress from earlier in the conflict has eased, but the situation continues to drive significant swings in oil prices and broader market sentiment. Progress toward a resolution would be a positive development for markets, while a breakdown in talks could trigger more volatility.
Major U.S. Equity Indices Continue to Set New Highs
U.S. stocks extended their rally to six consecutive weeks, with three of the four major indexes reaching new highs. The S&P 500 gained 2.0%, the Nasdaq rose 4.0%, and small-cap stocks climbed 1.5% to set a new high of their own.
Most of the week's gains came in a single session, following reports of progress on an Iran deal.
Why it matters: The pattern has been consistent through this stretch of geopolitical uncertainty. Headlines create short bursts of volatility, but the market has recovered as conditions stabilize. Six consecutive weeks of gains, including new highs across multiple broad equity indexes, reflects a market that continues to look through near-term uncertainty toward the underlying fundamentals.
Leading Tech Companies Report Strong Earnings and Increasing AI Capital Expenditures
The largest technology companies reported earnings over the past two weeks, and their commitment to AI infrastructure spending continues to grow. Alphabet, Amazon, Meta, and Microsoft all beat estimates, but the capital spending figures drew the most attention.
Meta raised its full-year capital spending guidance to $125 to $145 billion, Microsoft spent nearly $32 billion in a single quarter, and Alphabet's cloud backlog nearly doubled. Combined, the top four U.S. cloud providers are now projected to spend over $660 billion on infrastructure in 2026.
Why it matters: The spending isn't speculative in the way it once appeared, with the group posting strong revenue growth. Given these companies' large index weights, the reported growth is one of the forces pushing broad market indexes higher.
April Payrolls Beat Expectations as the Labor Market Holds Steady
The April employment report came in stronger than expected. Nonfarm payrolls rose by 115,000, down from the 185,000 created in an unusually strong March but better than the 55,000 forecast in the Dow Jones consensus estimate.
The unemployment rate held at 4.3%, further proof that the labor market has reached a point where only modest job creation is needed to keep the jobless level steady, given little growth in the labor force. Average hourly earnings came in lower than expected, increasing 0.2% for the month and 3.6% on an annual basis.
Beneath the headline, the picture was softer. A broader measure that includes discouraged workers and those holding part-time jobs for economic reasons rose to 8.2%, and the participation rate declined to 61.8%, the lowest since October 2021.
Why it matters: The labor market continues to defy expectations for a slowdown, but the softer details, slower wage growth and falling participation, point to a more cautious picture underneath. For investors, the report supports the view of a stable but cooling labor market, one that doesn't pressure the Fed in either direction at a time when policymakers are already navigating an oil shock and ongoing geopolitical risk.

Here's the Cost of Moving to the Sidelines
Markets rarely tempt investors to make bad decisions when things feel calm.
They tempt investors when the headlines are loud, losses are fresh, and moving to cash feels less like panic and more like prudence.
That is what made the first quarter so difficult.
From its late-January high through the end of March, the S&P 500 fell nearly 10% as the U.S.-Iran conflict pushed oil prices more than 60% higher. Headlines about the Strait of Hormuz, rising energy costs, and the potential economic fallout created the kind of environment where investors naturally begin asking a very human question:
Should I get out before this gets worse?
Market Timing Rarely Feels Like Market Timing
That question is understandable. It is also dangerous.
The problem with market timing is that it rarely feels like market timing in the moment. It feels like caution. It feels like discipline. It feels like protecting what you have built.
But getting out is only half the decision.
You also have to know when to get back in.
And that second decision is often the harder one.
When ceasefire talks emerged in late March, markets quickly began to recover. Investors who moved to the sidelines during the selloff were then faced with a new question:
Do I get back in now, after the market has already bounced, or do I wait until things feel calmer?
That is where many investors get hurt.
By the time the environment feels safe again, the market has often already moved. The recovery does not usually announce itself ahead of time. It often begins while the headlines are still uncomfortable, while the outcome is still uncertain, and while investors are still waiting for confirmation.

The Best and Worst Days Arrive Together
That is why the best and worst days in the market tend to arrive close together.
Figure 1 illustrates this pattern. The chart shows the S&P 500's daily returns over the past 26 years and highlights an important truth: the market's largest moves tend to cluster. The biggest selloffs do not happen in isolation. They are often surrounded by some of the strongest rallies.
We saw this during the 2008 financial crisis. We saw it during the 2020 pandemic. We saw it during the tariff-driven volatility of 2025. And we saw it again during the recent U.S.-Iran volatility, when the S&P 500 posted its strongest daily return since April 2025 on optimism around a possible ceasefire, only days after escalating tensions had pushed stocks lower.
That is the uncomfortable reality of investing through uncertainty.
The same environments that produce sharp selloffs often create the conditions for sharp recoveries.
Missing a Few Days Can Cost You Decades
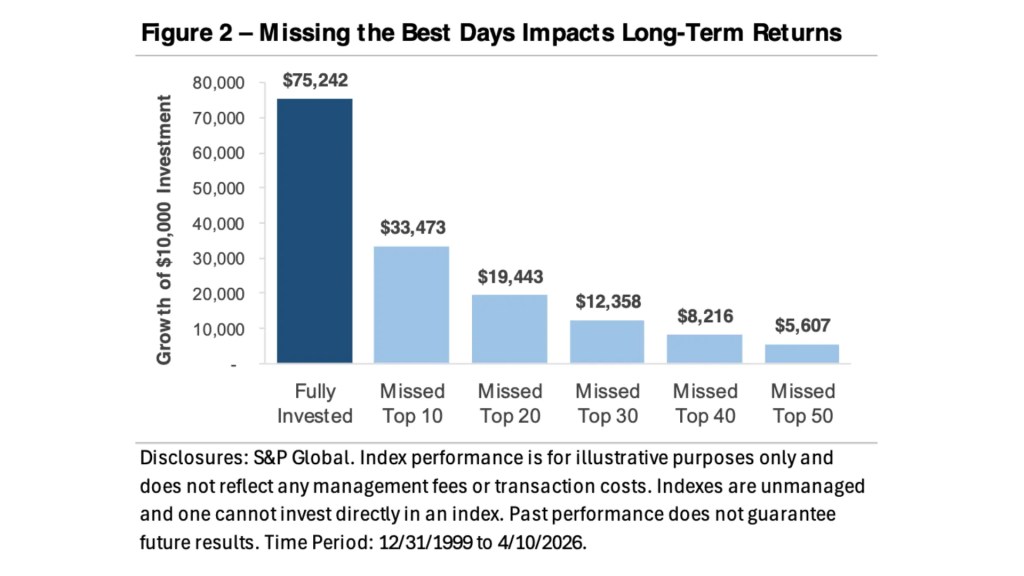
Figure 2 puts a dollar amount on that lesson. A $10,000 investment in the S&P 500 on December 31, 1999, would have grown to $75,242, despite a period that included the dot-com bust, the global financial crisis, the pandemic, inflation shocks, rising rates, wars, and political uncertainty.
That result did not come from avoiding every downturn.
It came from staying invested through them.
Missing just the 10 best trading days would have reduced the ending value to $33,473, less than half the fully invested result. Missing the 20 best days would have lowered it to $19,443. Missing the 30 best days would have brought it down to $12,358. And missing the 50 best days would have turned the original $10,000 into just $5,607.
In other words, an investor could have lived through a period when the market created substantial wealth, yet still lost money by missing too many of the right days.
That is what makes market timing so costly.
You do not have to be wrong all the time. You only have to be wrong at a few critical moments.
Bottom Line
This year's volatility may feel unsettling, but it reinforces one of the most important principles of long-term investing: the plan has to be built before the panic arrives.
A well-constructed financial plan does not assume markets will always cooperate. It assumes there will be downturns. It assumes there will be recessions. It assumes there will be geopolitical shocks, energy price spikes, scary headlines, and stretches of time when discipline feels uncomfortable.
That is why cash reserves matter.
That is why diversification matters.
That is why rebalancing matters.
And that is why your investment strategy should be connected to your broader financial plan, not just to your feelings about the latest headline.
Selling during a decline may provide temporary emotional relief, but it also locks in losses and creates a difficult re-entry problem. Staying invested does not mean ignoring risk. It means managing risk through a plan rather than reacting to fear.
What the Market Actually Rewards
The market does not reward perfect timing.
It rewards patience, discipline, and the ability to stay anchored when the headlines are loud.
And as the first quarter reminded us, missing just a few of the market's best days can come at a very high cost.

Weekly Market Update: Relief Rally Lifts Markets to New Highs as Ceasefires Hold
Markets surged in April as a series of diplomatic breakthroughs lowered the risk of further military escalation, with the S&P 500, Nasdaq, and Russell 2000 all closing at fresh all-time highs and erasing the first quarter's losses.
Leadership was narrow, however, and the gains were uneven beneath the surface. Growth stocks outpaced value by +8%, reversing the first quarter's rotation, and semiconductors rallied +40% on a 17-day winning streak. The average stock across the S&P 500 underperformed the index by nearly -4.5%, and all ten remaining sectors trailed technology.
Bonds were mixed. Treasury bonds produced modest losses as yields drifted higher, while corporate bonds traded higher as credit spreads tightened. Oil whipsawed on geopolitical headlines, with WTI crude rising +7% but trading in a wide $80 to $115 range, and a measure of market volatility fell sharply as investors unwound the geopolitical risk premium.
Ceasefires Drove the Rally, Oil Supply Disruption Remains
Stocks surged as the U.S.-Iran ceasefire was extended, the Israel-Lebanon ceasefire held, and de-escalation rhetoric reduced the risk of a wider ground war. Markets responded by unwinding the geopolitical risk premium that had weighed on equities throughout the first quarter.
The U.S. naval blockade of Iranian ports remains in effect, however, and the Strait of Hormuz remains functionally closed.
Why it matters: The diplomatic track and the physical supply situation are moving in opposite directions. Whether April's rally holds may depend on whether the Strait reopens.
Fed Outlook Shifts from Possible Hikes to Possible Cuts
Markets repriced Fed expectations at each remaining 2026 meeting, shifting from pricing in possible hikes to pricing in possible cuts. The most likely outcome is still no change, with cut probabilities below 15%, but the move reflects a meaningful change in tone driven by oil's pullback easing near-term inflation fears.
The Fed is also preparing for a leadership transition, with Kevin Warsh set to succeed Jerome Powell when his term expires in May.
Why it matters: The Fed's policy path has become harder to read at the same moment its leadership is changing hands, leaving markets to navigate both inflation risk and institutional uncertainty.
Q1 Earnings Off to a Strong Start, Margins Hit Record
First-quarter earnings season started strong, with the quarter on pace for a sixth consecutive quarter of double-digit growth and profit margins reaching a record 13.4%. Analysts now forecast +18% earnings growth over the next 12 months.
Forward valuations rose to 21x from 19.7x at quarter-end, with a meaningful portion of the move tied to rising earnings estimates rather than pure multiple expansion.
Why it matters: With valuations elevated and the geopolitical backdrop still volatile, earnings growth has become the primary path to further upside, and the rising bar means continued delivery will be needed to sustain current levels.
Rally Breadth Narrow Despite New Highs
The S&P 500 reclaimed key trend levels and closed near an all-time high, fully erasing March's -9% drawdown. Risk appetite surged as credit spreads tightened, volatility fell, and institutional equity futures positioning moved to its highest level since late 2024.
Beneath the surface, the rally was concentrated in semiconductors and mega-cap stocks rather than broad-based participation, and some measures of investor sentiment remained subdued.
Why it matters: Sustained rallies historically require broadening participation, and the current concentration leaves the index vulnerable if sentiment around the AI and growth trade shifts.
Economy Rebounds, Inflation Picture Worsens
The U.S. economy grew +2% in the first quarter, rebounding from +0.5% in the fourth quarter as the government shutdown effect reversed. Manufacturing held above the expansion threshold for a third consecutive month, and unemployment edged lower to 4.3%.
The inflation picture is less encouraging. Headline consumer prices surged +0.9% in March, the highest since June 2022, and the Fed's preferred core inflation measure remains elevated at +3.2% year-over-year and trending higher.
Why it matters: The growth picture is firming up at the same time the inflation picture is deteriorating, and the longer oil remains elevated, the harder it becomes for the Fed to ease policy later this year.
May Calendar Brings Fed Transition and Continued Earnings
The month ahead is one of the more consequential on the calendar this quarter. The Fed meets in May for what will be Chair Powell's final meetings before Kevin Warsh takes over, and the second half of Q1 earnings season continues with results from a broad range of companies.
Oil and the status of the Strait of Hormuz remain the key variables outside of corporate fundamentals.
Why it matters: How Powell frames the inflation and growth outlook on his way out, the tone Warsh signals on his way in, and any movement on the physical oil supply situation could each set the tone for markets heading into the summer.
Weekly Market Update: Oil Shock Pushes Yields to Fresh Highs
Markets traded lower this week as the conflict in the Middle East intensified and oil prices surged 17%.
The S&P 500 and Nasdaq each declined roughly 2%, while the Russell 2000 finished the week down about 1.5%. Most equity factors also moved lower, including Growth, Value, and Equal Weight, as market participation weakened.
Momentum and High Beta were the two exceptions. Both outperformed after lagging in recent weeks, helped in part by continued weakness across semiconductor stocks.
At the sector level, Energy and Utilities led the market higher. Meanwhile, Consumer Discretionary declined nearly 7% as investors considered how higher fuel and transportation costs could affect household spending and corporate profit margins.
Bonds also traded lower as interest rates rose across the yield curve. Longer-maturity bonds underperformed, which is typically what we’d expect when investors become more concerned about inflation. The VIX climbed back toward 20 late in the week, while the U.S. dollar strengthened as interest rates rose and market volatility increased.
Key Takeaways
Oil Prices Rise as the U.S.-Iran Conflict Escalates
The United States carried out a twelfth consecutive night of strikes this week, while Iran continued targeting tankers traveling through the Strait of Hormuz. The strait is one of the world’s most important energy corridors and carries a significant share of the global oil trade.
Meanwhile, Yemen’s Houthi rebels added another layer of uncertainty by threatening a naval blockade against Saudi Arabia. That threat raises the possibility of disruption not only in the Strait of Hormuz, but also across shipping routes in the Red Sea.
Oil prices responded quickly. West Texas Intermediate crude climbed above $90 per barrel, while Brent crude, the international benchmark, briefly touched $100. Both reached their highest levels in roughly six weeks.
At the same time, there’s been little visible diplomatic progress. Secretary of State Marco Rubio said Iran was “not serious about talks,” reducing near-term expectations for a negotiated resolution.
Why It Matters: The conflict had shown signs of stabilizing, but each additional strike, tanker attack, or threat to shipping routes introduces a new risk premium into oil prices.
The issue isn’t simply whether oil reaches a particular price. What matters is how long prices remain elevated and whether those higher costs begin working their way through transportation, manufacturing, utilities, and consumer spending.
In other words, the longer the conflict continues, the greater the chance that an overseas geopolitical event turns into a broader inflation and economic-growth concern for the United States.
Rising Oil Prices Push Treasury Yields to Fresh 52-Week Highs and Revive Expectations for a Fed Rate Hike
This week’s move in Treasury yields was a direct extension of the Middle East story.
The 10-year Treasury yield rose above 4.70%, reaching a new 52-week high, as investors began pricing a greater risk that higher energy costs could keep inflation elevated.
Expectations for Federal Reserve policy also shifted. Fed funds futures now assign a greater than 80% probability to an interest-rate increase at the Fed’s September meeting, up from approximately 50% one week ago.
That’s a meaningful change in a short period of time. It suggests that investors are no longer viewing the rise in oil prices as an isolated market event. Instead, they’re considering whether higher energy costs could affect the Fed’s broader inflation outlook.
Why It Matters: Treasury yields are now closely tracking developments in the Middle East, which highlights how interconnected energy markets, inflation expectations, and interest rates have become.
Higher yields can create pressure across several parts of the economy. They can raise borrowing costs for households and businesses, weigh on bond prices, and make it more difficult for highly valued stocks to justify their current prices.
However, the key question for the Fed is whether the rise in energy prices is temporary or whether it begins affecting wages, consumer expectations, and the prices of other goods and services.
A short-lived oil shock may not change the Fed’s plans. A prolonged inflationary shock could.
Alphabet’s Strong Quarter Was Overshadowed by a Growing AI Capital-Spending Commitment
Alphabet reported second-quarter results Wednesday that exceeded expectations across several major areas.
Revenue increased 24% to $120 billion, Google Cloud revenue jumped 82%, and operating margins expanded. By most traditional measures, it was a strong quarter.
However, Alphabet shares still declined approximately 5% in after-hours trading as investors focused on the amount of spending required to produce that growth.
The company increased its 2026 capital-expenditure guidance to between $195 billion and $205 billion, up from its previous range of $180 billion to $190 billion. Management also indicated that spending would increase again in 2027.
Meanwhile, quarterly free cash flow turned negative for the first time in the company’s history as capital spending exceeded the cash generated by its operating businesses.
Why It Matters: The market doesn’t appear to be questioning whether artificial intelligence is contributing to growth. Alphabet’s results provide strong evidence that it is.
Instead, investors are asking a more difficult question: How much will companies have to spend to generate that growth, and when will those investments begin producing an attractive return?
That distinction matters because revenue growth alone doesn’t necessarily create shareholder value. Companies also need to demonstrate that the cash invested in data centers, chips, energy, and other AI infrastructure can eventually produce sustainable profits and free cash flow.
For now, the market appears willing to support substantial AI investment. However, investors are becoming less willing to accept an unlimited spending commitment without clearer evidence of the eventual payoff.
Next Week’s Calendar Could Answer Many of These Questions
Several of the market’s biggest current debates will be tested within a two-day period next week.
The Federal Reserve’s two-day meeting concludes Wednesday, July 29, with an interest-rate decision and press conference. Investors will be listening closely for signs that officials view higher energy prices as a temporary disruption or as a reason to reconsider the path of monetary policy.
Microsoft and Meta will report earnings after the market closes that same day. Their results will provide two more important data points in the debate over AI-related spending, revenue growth, and investment returns.
Then, on Thursday, investors will receive the advance estimate of second-quarter gross domestic product and the June Personal Consumption Expenditures Index, the Fed’s preferred inflation gauge.
Apple and Amazon will report earnings after Thursday’s closing bell, adding additional information about consumer demand, cloud computing, and corporate technology spending.
Why It Matters: Nearly every major question discussed this week will face a real-world test next week.
The inflation data may show whether price pressures were already building before the latest rise in oil. The Fed’s comments may clarify whether officials are prepared to respond to energy-driven inflation. Meanwhile, the technology earnings reports may reveal whether AI spending is continuing to generate enough growth to justify its rapidly rising cost.
Any one of these events could move markets. Taken together, they could determine whether this week’s volatility was a temporary response to geopolitical uncertainty or the beginning of a more meaningful shift in the market’s outlook for inflation, interest rates, and corporate profits.