
Here’s How to Prepare for the Next Market Dip
Who doesn’t love a good market rally? It’s the time when investment account balances continue to move higher and retirement options continue to solidify.
Market Rallies and the Reality of Pullbacks
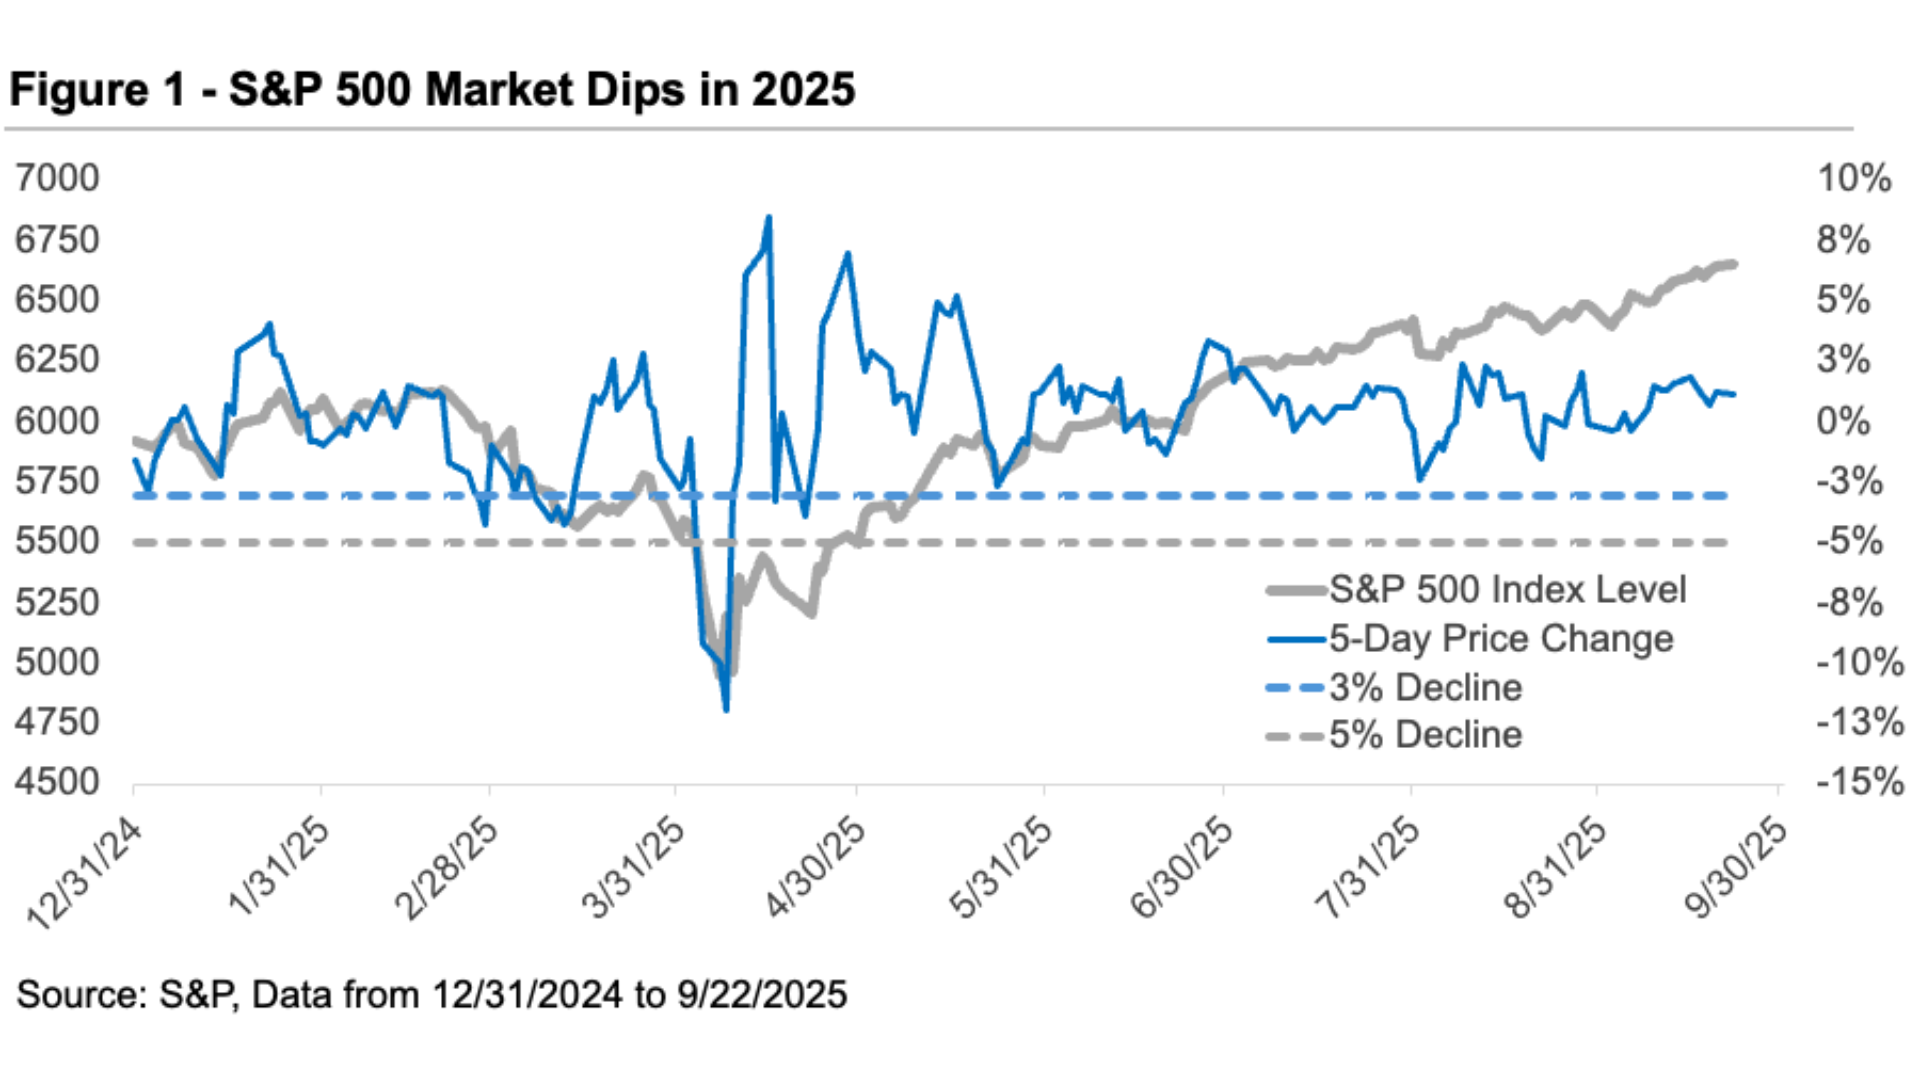
But we know that markets don’t move up in a straight line, despite what we’ve seen over the past few months. According to Ned Davis Research, market dips of around 3% happen about seven times per year on average, and corrections of 5% or more occur roughly three times annually.
In other words, pullbacks aren’t unusual, they’re a normal part of the investing landscape that investors should anticipate even when the backdrop is strong.
And here’s the thing: since April’s selloff, the S&P 500 index has not experienced a sustained market dip greater than 3% and that’s worth noting.
What goes up, must come down, right? Maybe for a bit, then often right back up. That’s the mindset we want to focus on: enjoy the rally, yet be ready for the routine setbacks that come with healthy markets.
Staying Grounded is Essential
That’s why now, more than ever, is the right time to stay grounded and position your portfolio for an inevitable bout of market volatility. Now, preparation doesn’t necessarily mean pessimism, but rather it’s how you participate in the upside while keeping your footing when markets take a breather.
Because if you don’t, you could end up leaving money on the table when the market pulls back.
How so?
Well, the fact of the matter is that there are two key areas that you'll want to be prepared for when the markets eventually take a turn.
First, not giving up gains unnecessarily by avoiding mistakes that leave money on the table.
Second, not missing out on potential tax planning opportunities when asset prices do pull back.
Taken together, these help you stay constructive and benefit across cycles.
Let's take a look at this more closely.
What the Current Market Is Telling Us
So far this year the S&P 500 index is up over ten percent. And while this double-digit return for domestic stocks is quite notable, it's also worth noting that international stocks are up well over 20% so far this year.
There's a case to be made for the ongoing rally in international stocks and risk assets in general, especially as interest rates fall and the dollar continues to weaken.
Even so, while risk assets continue to rally higher on expectations that the Federal Reserve cutting interest rates will make it more favorable for risk assets to rally, the very backdrop that prompts policymakers to cut rates suggests U.S. economic growth could still face headwinds.
And while the U.S. economy has been generally steady in 2025, there’s a very real potential that any incoming data pointing to fractures in the solid growth story could give investors reason for pause, leading to a market pullback.
That kind of pause is consistent with history and with the Ned Davis data on frequent, modest setbacks, not a reason to abandon a long-term plan.
Why Cash and Taxes Matter Most
In anticipation of this market pullback, there are two things to consider doing before the market actually turns, and some actions you can take when the markets are actually in a pullback.
To start, cash is king when it comes to periods of heightened market volatility. That’s why now is the time to evaluate your cash management plan and make sure that your reserves are properly topped up to cover the unexpected.
This means that if you're still in your working years, make sure you have between 6 to 9 months of cash on hand or liquid assets available just in case to cover unexpected expenses.
And if you're already retired or approaching retirement, now would be the time to make sure that you have between 12 and 18 months of liquid cash reserves available to cover your living expenses. The last thing that you want to do during a market downturn is sell assets at an inopportune time and lock in losses.
Think of cash as both a defensive buffer and an offensive enabler that lets you avoid forced selling and gives you flexibility to act on opportunities when others can’t.
The second approach to take and consider when the inevitable market pullback does come is to think about how you're positioning yourself from a tax perspective. More specifically, one of the big things that we focus on during periods of market weakness is taking advantage of Roth conversions.
That's because market sell-offs temporarily lower asset values, giving us an opportunity to realize lower taxable amounts when moving money from qualified accounts like IRAs or 401(k)s into a Roth IRA and positioning those assets for future tax-free growth and withdrawals. This is a clear example of not leaving money on the table: using normal volatility to improve your after-tax outcomes.
Staying Grounded with Cautious Optimism
When it comes down to it, nobody wants to be the person who washes away a market rally by thinking about or talking about the potential for a pullback.
Nevertheless, history has shown repeatedly that all good things include periodic setbacks. And when they do, they often happen without warning, happen suddenly, and lead to regret for the unprepared.
Acknowledging that reality is part of being cautiously optimistic: we respect the risks so we can stay invested for the rewards.
While there's a case to be made for assets to continue to rally in the months ahead, there's no better time than the present to practice prudent portfolio management.
Sticking to a disciplined investment strategy, keeping appropriate cash reserves, using volatility-aware tax strategies like Roth conversions, and rebalancing your portfolio help ensure you're not leaving money on the table and not paying Uncle Sam any more than his fair share.
That’s how you remain grounded and prepared for when the markets eventually rally once again.


How Withdrawal Rates Impact Your Portfolio in Retirement
Many people spend years preparing for retirement by saving and investing, but planning shouldn’t stop once the paychecks do. Transitioning from earning income to withdrawing it from your portfolio is a major shift with a new set of risks and decisions. This period, known as the distribution phase, requires careful thought.
How much you withdraw each year can have a bigger impact on long-term financial security than many people realize. Without a well-structured strategy, even a sizable retirement account can be depleted faster than expected.
The Impact of Withdrawal Rates
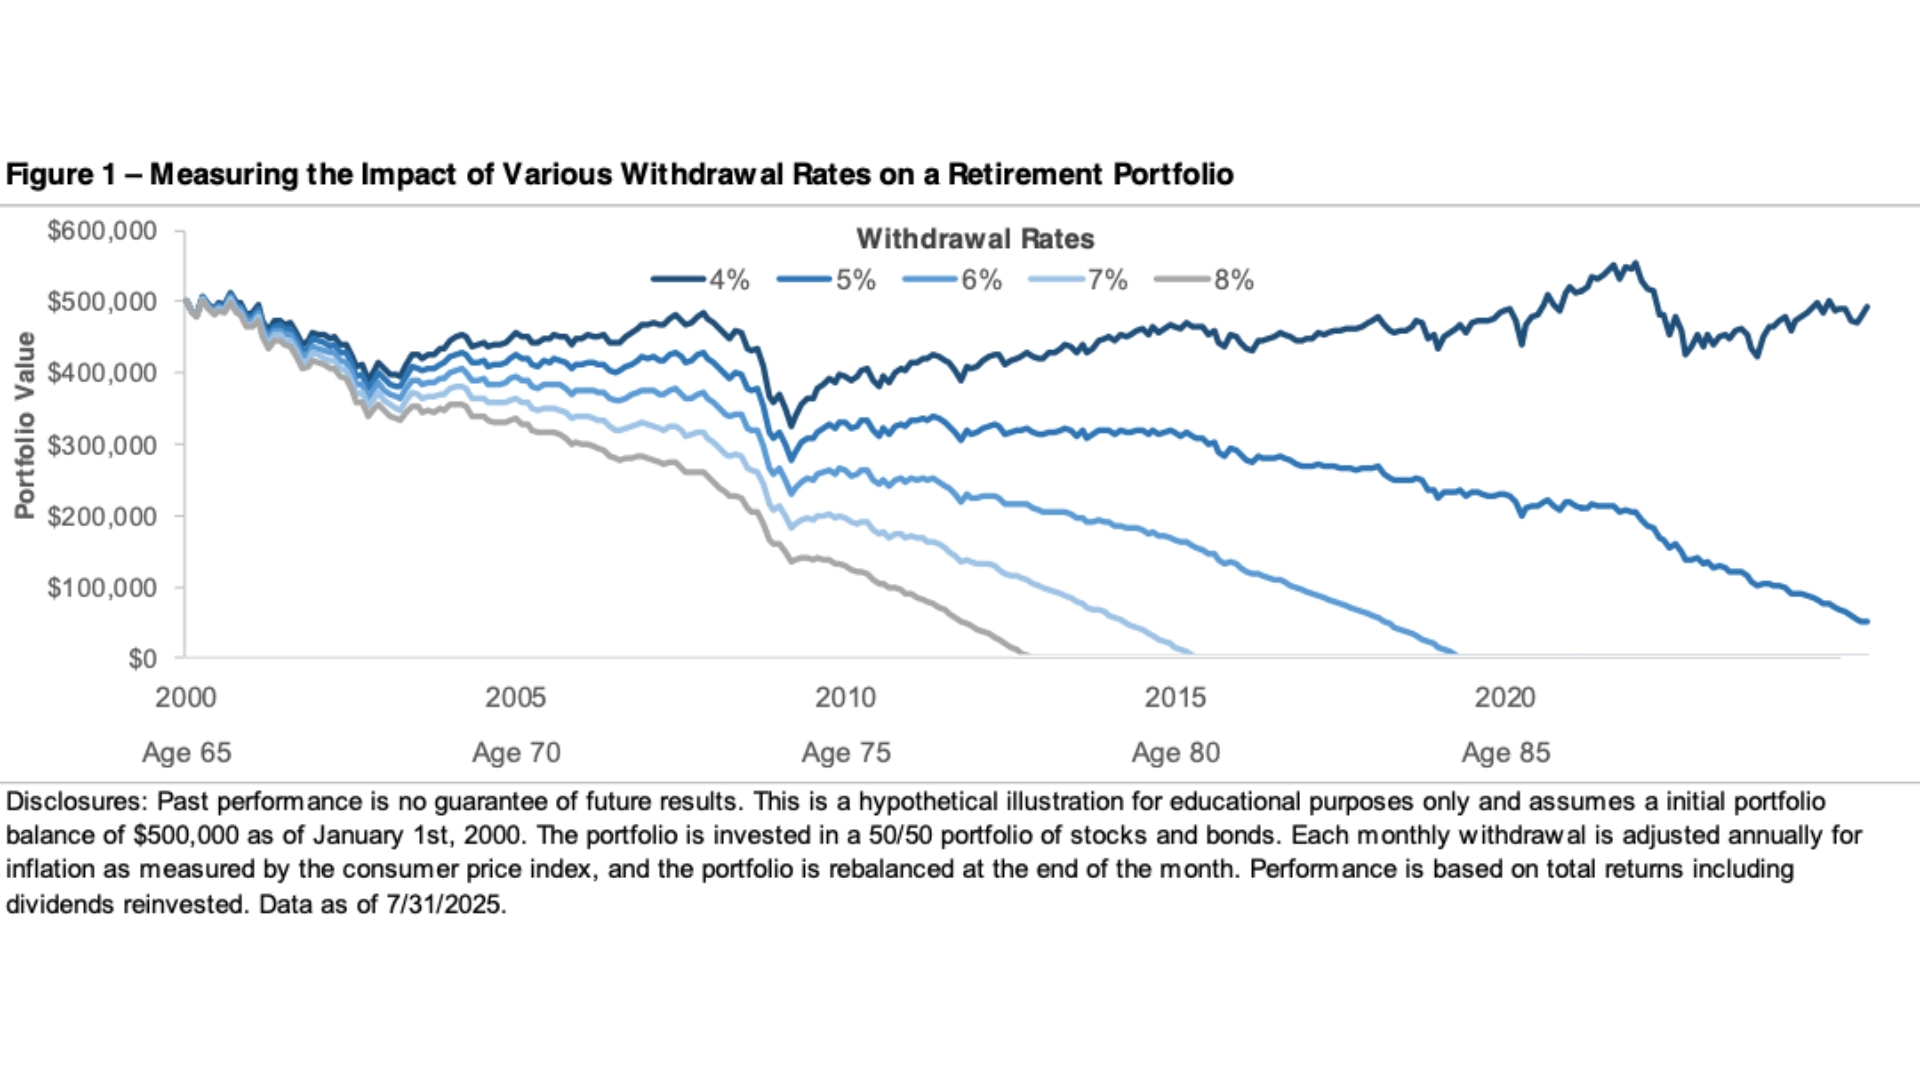
The chart below shows how different withdrawal rates can impact a retirement portfolio’s lifespan. It assumes an individual retired in 2000 at age 65 with $500,000 and started taking monthly withdrawals.
Each line reflects a different withdrawal rate between 4% and 8%, showing how the portfolio fared through age 85. While all scenarios start at the same point, the paths quickly diverge, especially during periods of market volatility. The chart illustrates how a retiree’s withdrawal strategy can determine whether the portfolio lasts or runs out.
The message is clear: higher withdrawal rates tend to exhaust a portfolio sooner, while lower rates can extend its life. In this example, withdrawing 7% or 8% caused the portfolio to run out of money before age 85. In contrast, the 4% and 5% withdrawal rates helped the portfolio weather market declines.
Does a 4% Rate Still Cut It?
The 4% strategy not only preserved the portfolio but grew it over 20 years, showing how compounding can work even during retirement. No strategy can eliminate market risk, but a smaller withdrawal rate can extend the portfolio’s life and reduce the risk of outliving your savings. Taking a more conservative approach in the early years of retirement gives your portfolio time to recover from short-term losses and grow with the market.
A thoughtful withdrawal strategy is an important part of retirement planning. It’s not just about how much you’ve accumulated, but how you manage it. There’s no one-size-fits-all approach, and the method you start with doesn’t have to be permanent. Fixed withdrawal rates can provide a good starting point, but many retirees may benefit from more flexible approaches.
The Big Takeaway
For example, you could adjust withdrawals based on market conditions, taking smaller distributions in down years and larger ones in strong years. Another option is the bucket strategy, which divides assets into short-, intermediate-, and long-term segments.
By keeping at least 18 months worth of expenses in cash or short-term investments, you can avoid selling stocks during major market declines, such as those in 2008 or 2020. This gives long-term investments time to recover and can help create a steadier income stream over time. Everyone’s retirement looks different. Our goal is to help you create a withdrawal strategy tailored to your unique needs and goals when that time comes.
Two Quarters, Two Stories: A Market That Came Full Circle
The first half of 2025 delivered a tale of two very different quarters.
After stumbling out of the gate with a sharp selloff in the first quarter of the year, markets found their footing in the second quarter.
Indeed, what began as a year marked by caution, driven by rising policy uncertainty, slower growth concerns, and questions surrounding the durability of the AI boom, sentiment shifted dramatically as headlines softened, tariffs proved less disruptive than feared, and corporate earnings came in stronger than expected.
And yet, for all the twists and turns, markets ended the first six months surprisingly close to where they began.
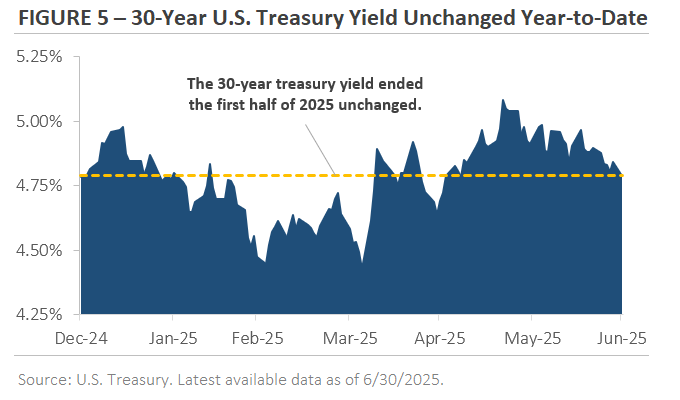
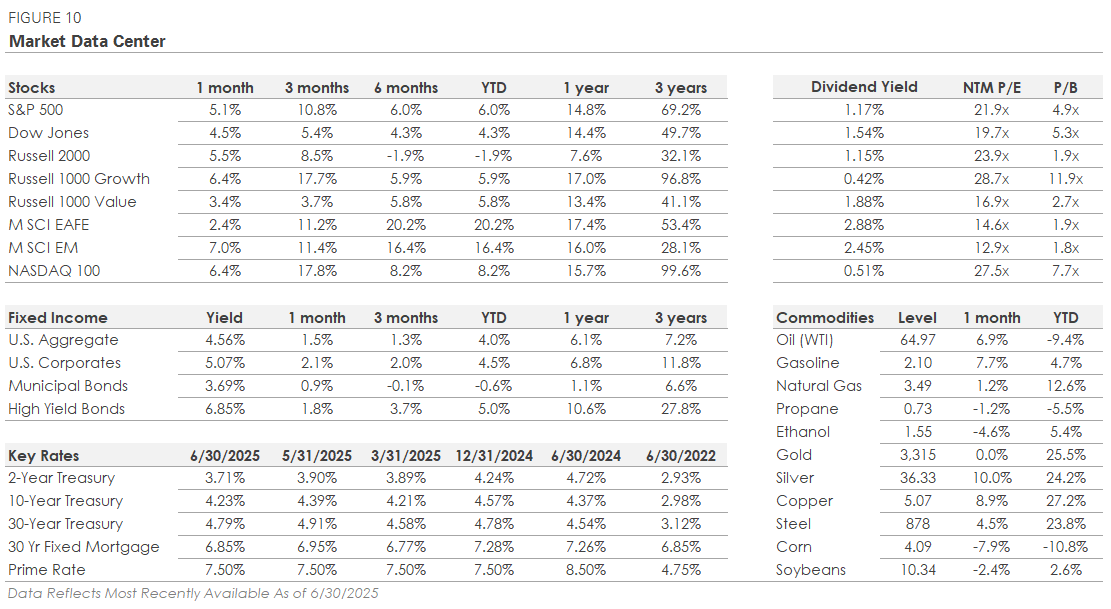
The S&P 500 returned a gain of 6.1% through June, which is a notable rebound from being down more than -15% earlier in the year. Long-term interest rates told a similar story with the 30-year U.S. Treasury yield swinging widely between 4.40% and 5.10%, but finished June just a touch below where it started, near 4.80%.
To the casual observer, it may seem like little has changed. But under the surface, the story is far more nuanced, and still worth watching as we head into the second half of the year.
Markets Ride a Wave of Policy Whiplash
Now, if there’s one word that’s defined the first half of 2025, it’s “whiplash.”
And trade policy was at the center of it all. That’s because what started as a steady drumbeat of tariff escalation early in the year gave way to a flurry of de-escalation efforts just weeks later which left businesses, investors, and global partners scrambling to make sense of the shifting landscape.
As you’ll likely recall, the escalation phase took hold in February and March, with sweeping tariffs targeting imports from China, Canada, Mexico, and broader categories like steel, aluminum, and autos.
Then, just as tensions peaked in early April with the announcement of tariffs on nearly all imports, the tone reversed. A week later, the Trump administration paused reciprocal tariffs for every trading partner except China. And by early May, a new trade agreement with China signaled further cooling.
Yet, despite this pivot, the uncertainty still hasn’t gone away.
Because in late May, a U.S. trade court ruled the sweeping tariff measures unconstitutional, and by June, the administration was already signaling the possibility of reinstating certain tariffs. With July and August deadlines looming for tariff exemptions, we’re entering another chapter of policy ambiguity.
So then, for markets and businesses alike, the story that we’re tracking is not just the tariffs themselves, it’s the pace and unpredictability of change that’s creating the most friction.
And until clarity returns, volatility may remain part of the ride in the months ahead.
Tariff Talk Hits the Economy, But Not How You Might Expect
Now, one of the more surprising outcomes of this year’s trade drama is how quickly it filtered into the economic data and not through slowdown as we had expected, but through acceleration.
How so?
Well, in the first quarter, businesses and consumers raced to front-run potential price increases by pulling forward purchases. Imports of consumer goods and industrial supplies spiked, while vehicle sales surged in March and April, reflecting a scramble to buy ahead of expected tariffs.
These moves weren’t part of a typical economic activity, it was a strategic move by business and consumers. It was less about improving demand and more about beating the clock on higher prices.
And this kind of behavior can distort short-term data. Because what might look like strength may simply be a shift in timing. And that makes it harder to assess the true underlying trend.
Another dynamic worth watching is inflation, specifically, the growing gap between what consumers expect and what’s actually showing up in the data. As shown in Figure 1, consumer inflation expectations have surged, even as official inflation readings, like the Consumer Price Index, continue to trend lower.
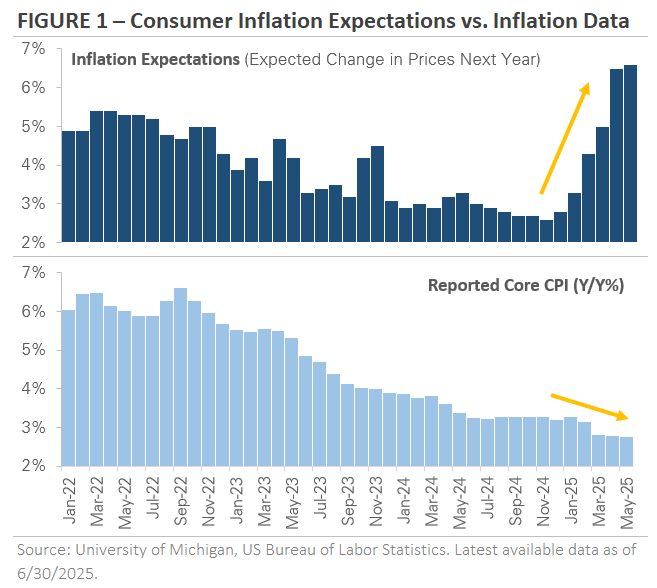
It’s a disconnect that speaks volumes because while prices haven’t materially risen yet, consumers are clearly bracing for what might come next.
Whether those expectations become reality remains to be seen because of different factors.
For example, some economists warn that inflation could pick up as tariffs ripple through supply chains over time, just as they had during the pandemic.
Yet others argue companies may absorb the cost increases to stay competitive. And the earnings season may offer early insight, particularly into how businesses are adjusting their pricing strategies and how much of the tariff story is already baked into forward guidance.
For now, however, the hard data remains calm. But expectations are restless. And in markets, that’s often where the story begins.
The Fed Stays Put While Markets Wait for Clarity
Now, uncertainty doesn’t just spook investors, it complicates policymaking as well. And for the Federal Reserve, this year’s shifting trade landscape has added a new layer of complexity to an already delicate balancing act.
On one hand, policymakers are contending with the fact that tariffs could ignite inflation.
On the other, tariffs might slow the economy if higher costs start to weigh on consumer demand and business investment.
So then, caught between those risks, the Fed held rates steady at both its May and June meetings, signaling that it needs more data before making its next move.
In other words, it’s a time for patience, which is now playing out in the markets.
Indeed, figure 2 illustrates the market’s evolving expectations for interest rates. The Fed’s current target range stands at 4.25% to 4.50%.
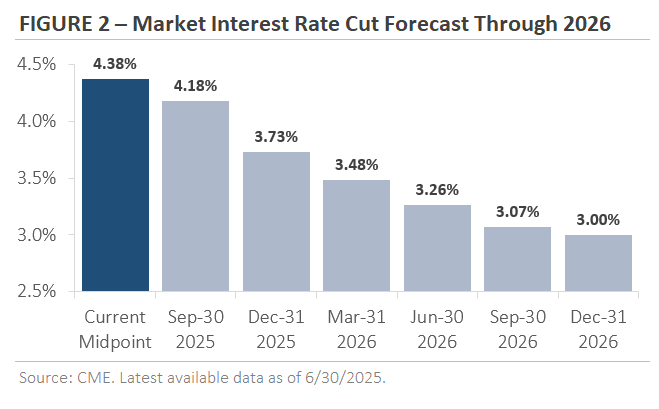
However, futures markets are now pricing in a gradual path of rate cuts beginning in September, with momentum picking up into 2026.
In other words, by the end of that year, investors expect the Fed to lower rates by approximately -1.25% from current levels.
That forecast reflects a kind of economic middle ground of inflation risks persisting, but the damage from tariffs appears contained for now. Still, as always, the path forward is highly dependent on what comes next.
Markets are adjusting their expectations in real time and so is the Fed. Therefore, any shift in inflation trends, labor market strength, or trade policy could quickly rewrite the script which is what we’re keeping an eye on.
But for now, the message is clear: until the dust settles, both the Fed and the market are content to wait.
Valuations Bounce Back as Sentiment Shifts
So, how has this trade and central bank policy affected the stock market? Well, after a rocky first quarter, investors seemed to flip the script in the second quarter.
That’s because, despite lingering uncertainty around trade and interest rates, the stock market staged an impressive rebound. And this came not because earnings surged, but because investors became more willing to pay up for the earnings already expected.
In other words, valuations (the price investors are willing to pay) not profits (earnings that support those prices) did the heavy lifting.
Figure 3 tells this story. The dashed light blue line tracks Wall Street’s 12-month earnings forecast for the S&P 500. The darker navy line shows the index’s price-to-earnings (P/E) ratio, or the multiple investors assign to those expected earnings.
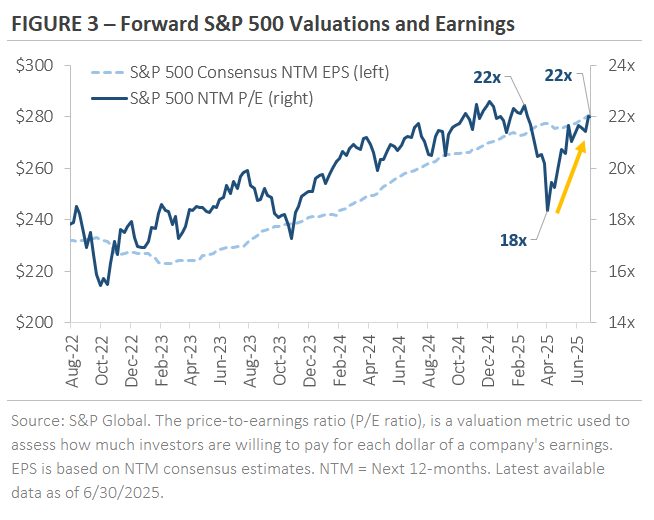 And at the end of 2024, the S&P 500 traded at roughly 22-times forward earnings. You’ll recall that at that time there was optimism around AI and pro-growth policies supported those higher valuations. But as trade tensions escalated in early April, sentiment cracked, and the P/E multiple fell to 18x almost overnight.
Here it wasn’t earnings that changed, it was mood.
But then came the rebound. As tariff concerns cooled and companies delivered better-than-expected first-quarter results, confidence returned. By late June, the P/E ratio had climbed back to where it started the year at just above 22x.
This kind of valuation whiplash is a reminder of how quickly investor sentiment can swing and why trying to time your way into (and out of the market) can be disadvantageous.
It also underscores the importance of understanding what’s driving market moves, not just earnings, but how much investors are willing to pay for them.
And so, with earnings season ahead, the focus now shifts to whether companies can meet or exceed the expectations embedded in these renewed valuations.
From Flight to Risk to Return to Risk-On
Now, we know that markets have rebounded, but it’s essential to also note that the players that previously led market moves higher (and lower) have changed hands this year.
Indeed, the first half of 2025 saw a dramatic rotation in market leadership, one that played out almost like two separate market cycles in rapid succession.
That’s because in the first quarter, uncertainty dominated and defensive stocks outperformed.
How so?
Well, during the uncertain times, investors sought stability in low-volatility names like utilities and healthcare, while higher beta, economically sensitive sectors lagged behind.
Then things changed on a dime in the second quarter.
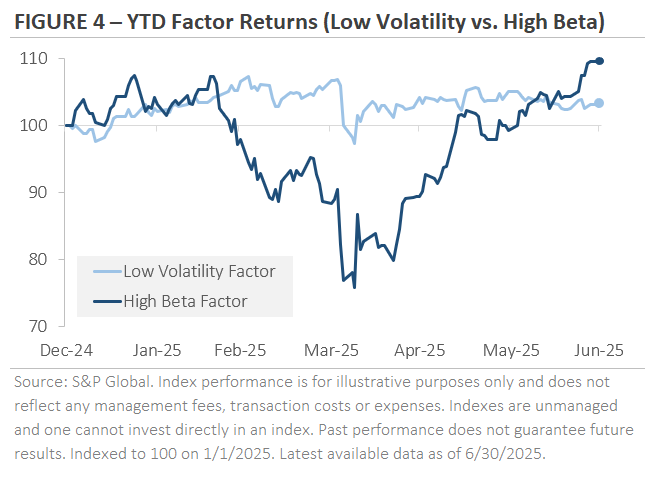
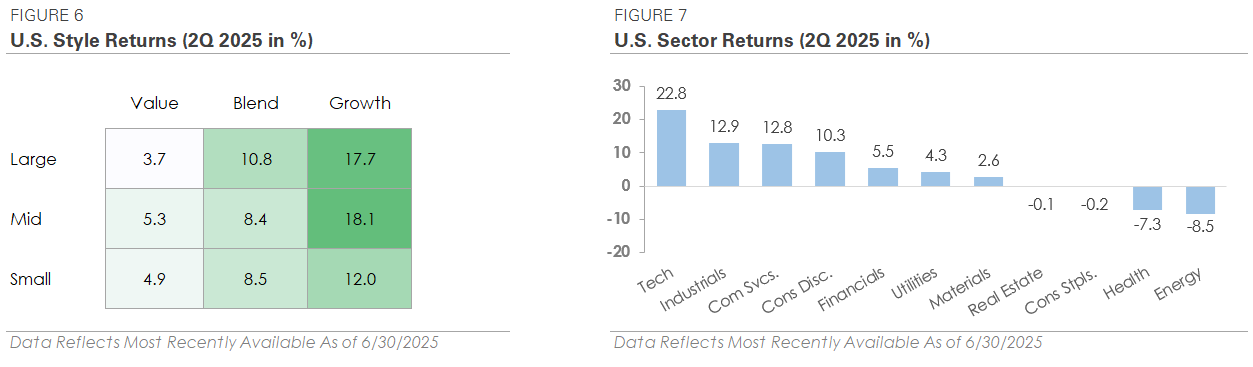
As policy tensions cooled and growth fears receded, risk appetite returned in force. Figure 4 highlights the shift by tracking the performance of low-volatility versus high-beta stocks.
In the first quarter, low volatility led by nearly 20%. And in the second quarter, high volatility outpaced low volatility by over 25% which fully erased its earlier underperformance.
That reversal extended beyond factors to asset classes and sectors.
- The S&P 500 rose 10.8% in Q2 after falling -4.3% in Q1.
- Small caps, which had been hit hard early in the year, bounced 8.5% in Q2.
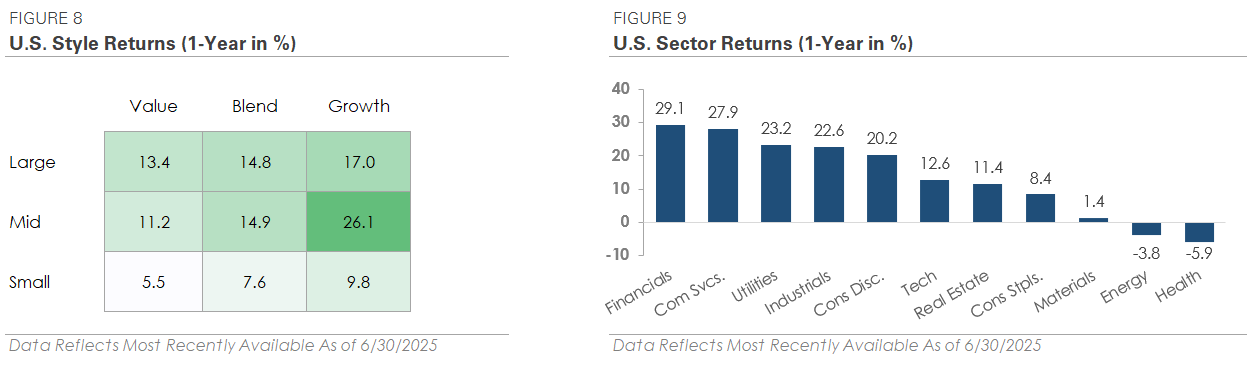
- Growth stocks reclaimed leadership: the Nasdaq 100 rallied 17.8%, and the Russell 1000 Growth Index surged 17.7%.
- The “Magnificent 7” tech giants, down -15.7% in Q1, came roaring back with a 21.0% return in Q2.
Meanwhile, value stocks posted more modest gains, as measured by the Russell 1000 Value Index which rose just 3.7% and is a reflection of the market’s clear tilt back toward risk and momentum.
International markets also quietly delivered another standout quarter. For example, developed and emerging market equities returned over 11% in Q2, outpacing U.S. stocks for a second straight quarter. However, it’s essential to note that much of that performance has been currency-driven, as a weaker dollar, pressured by tariff uncertainty and a shift in global flows, provided a tailwind for non-U.S. assets.
So then, if the first quarter was a flight to safety, then the second quarter was a return to growth and a powerful reminder of just how quickly market leadership can change.
Bonds Caught Between Calm and Concern
And what about the bond market?
Well, much like equities, the bond market experienced its own version of a two-act play in the first half of the year, though the themes were more subtle and the signals more nuanced.
At the start of 2025, long-term interest rates fell as investors digested policy uncertainty and softening growth expectations. For example, the 30-year U.S. Treasury yield, a barometer for long-term sentiment, slipped from 4.80% to 4.40% by early April.
This move came as investors were seeking safety, and longer-dated Treasuries provided it.
But things changed here just as quickly as the narrative changed.
As tariff tensions eased and inflation expectations crept higher, long-term yields reversed course. And so, by late May, the 30-year yield climbed back above 5.10%, before settling at 4.79% by quarter-end and almost exactly where it began the year.
Indeed, figure 5 captures this round-trip in yields, reflecting the market’s attempt to weigh slowing growth against rising fiscal uncertainty and sticky inflation.
Within credit markets, sentiment shifted as well.
In the first quarter, corporate credit spreads widened, particularly in high-yield bonds, as investors grew more cautious. But the second quarter also brought renewed confidence, with recession fears fading and earnings holding up, and credit spreads tightened.
High-yield bonds outperformed, delivering a 3.7% return in the second quarter, versus 2.0% for investment-grade corporates. That marked a sharp reversal from the risk-off posture earlier in the year.
So where does that leave us in the bond market?
Well, treasury yields have gone nowhere, but not quietly. Volatility and rotation have made the ride anything but smooth. Credit markets, meanwhile, appear cautiously constructive, suggesting that while risks remain, investors are still finding value in income-generating assets.
As always, bonds continue to serve their purpose in a well positioned portfolio, providing diversification, stability, and ballast when equity markets are on the move.
Looking Ahead: Focus on What You Can Control
So then, where do we go from here?
Well, we’ve watched the market swing from fear to relief, from sharp selloffs to near-record highs. We’ve navigated escalating tariffs, surprise de-escalations, legal rulings, and changing forecasts. And through it all, the numbers may have ended close to where they started, but it hasn’t felt that way.
Because volatility isn’t just about what’s happening in the markets. It’s also about what it stirs up in us.
In uncertain seasons like this, it’s natural to question what comes next or whether your strategy needs to change.
But here’s the good news: the plan we’ve built together already accounts for times like these.
Your portfolio isn’t built on perfect predictions. It’s built on the first principles of diversification, risk awareness, discipline, and a long-term perspective.
The truth is, we can’t eliminate uncertainty, but we can prepare for it. And we have.
So, if you find yourself wondering whether to act or adjust, here’s a better question to ask: “Is my plan still aligned with my long-term goals?”
If the answer is yes, then the best response may be no response at all.
And as we look to the second half of the year, we’ll continue monitoring policy developments, economic data, and corporate earnings. But more importantly, we’ll continue guiding your strategy with calm, clarity, and consistency, just as we always have.
Because peace of mind doesn’t come from chasing the perfect forecast. It comes from having a plan you can trust, and a partner walking through it with you.

What to Make of Weaker First Quarter Growth?
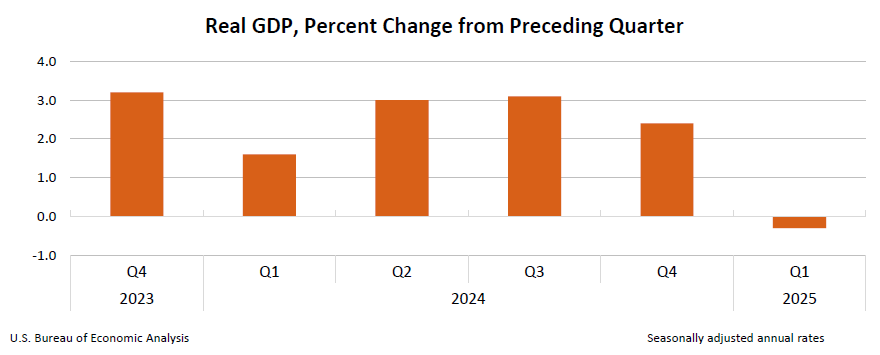
Last week, incoming data showed that the U.S. economy shrank in the first quarter of 2025, the first time in several years we've seen this happen.
Now, it's essential to note that one quarter of decline doesn't mean a recession is inevitable. But with today's unpredictable economic policies, it's fair to wonder if this could be the beginning of a short-term slowdown.
Why Predicting the Economy Is Harder Than Ever
Indeed, trying to figure out where the U.S. economy is going has never been easy. But in the years since the pandemic, it's become even more difficult.
That's because many of the tools economists used to rely on don't seem to work as well anymore. For example, when interest rates rise, that usually signals a slowdown or even a recession in the making.
But in the past five years, even with warning signs in place, Americans kept spending. And since consumer spending makes up over two-thirds of the U.S. economy, this has helped keep things growing.
So, what's changed?
Well, what's likely different this time around is the policy environment. We're dealing with a new set of economic rules and decisions that make predictions more complicated.
And these changing policies create more uncertainty, and that can weigh on both consumers and businesses. Because of this, the chances of a recession, or at least slower growth, may be rising as these policy effects ripple through the economy.
What Caused the First-Quarter Economic Decline?
So then, to better understand what's behind the recent slowdown, we need to look at the key parts of economic growth.
And as you'll likely recall from your economics courses in college, gross domestic product (GDP) is made of: 1) government spending, 2) business investment, 3) household spending, and 4) net exports (exports minus imports).
So, what did the data show us?

Well, in the first quarter, two things stood out as the leading causes of weaker growth: a drop in government spending and a sharp increase in imports.
Now, the rise in imports likely happened because of the Trade War, as businesses and consumers were trying to buy goods before prices increased.
To be sure, as trade tensions have returned, and tariffs on some items are now as high as 150%, that's led many to act early, stocking up before things get worse.
Now, the drop in government spending is more complicated.
That's because overall federal spending is still higher than in past years, but when adjusted for inflation and measured quarter by quarter, it appeared to fall. That technical dip was enough to drag down total economic output.
What the Numbers Don't Tell Us
While hard data like GDP shows us what already happened, it's also essential to pay attention to soft data, like how people and businesses are feeling about the future. This kind of information can help predict what's coming next.
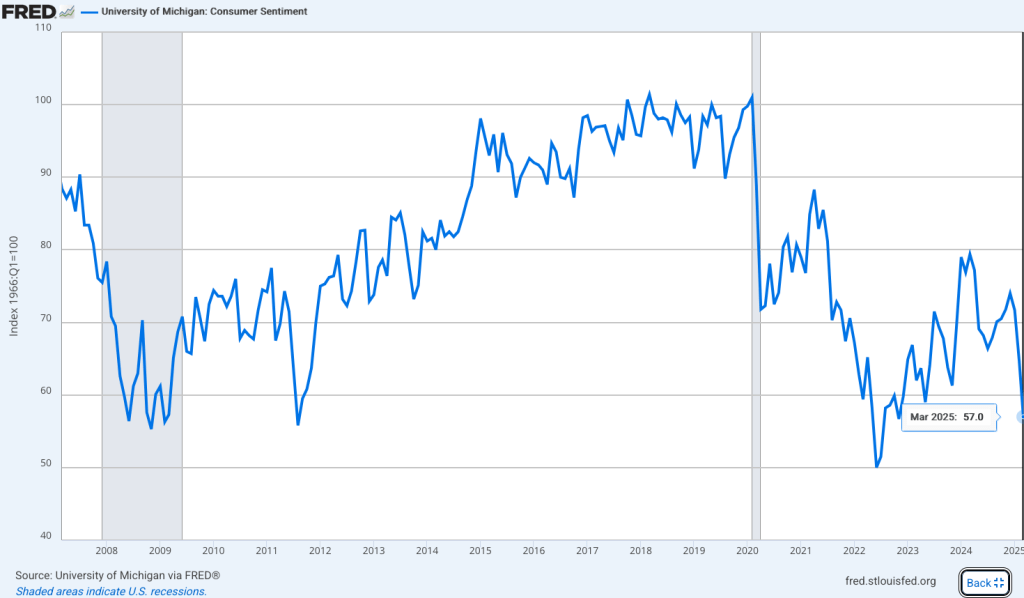
And lately, people haven't been feeling very confident. For example, a recent University of Michigan survey showed consumer confidence hit its lowest point in two years. A lot of that concern comes from worries about inflation and what future policies might bring.
We're also seeing changes in the job market. That's because data are showing there are fewer job openings, and layoffs are becoming more common. These are signs that employers are starting to pull back, something that often happens toward the end of an economic cycle.
And adding insult to injury, even shipping activity has slowed. At major ports on the West Coast, freight volumes have dropped, showing that businesses may be holding off on orders as they wait to see how trade issues unfold. All of this points to a more cautious mood taking hold across the economy.
The New Trade War: What's Changed?
Another factor adding pressure to the economic outlook is the return of Trump's Trade Wars.
But this time, businesses are handling the tariffs in a much different way than they had during Trump's first administration.
That's because, during the first trade war in 2018, many businesses chose to absorb tariff costs to keep their customers. But now, more of them are passing those costs directly to shoppers.
That makes everything more expensive, and if prices keep going up, people may start spending less. If trade problems continue, and if businesses and consumers respond by cutting back, it could create a chain reaction that leads to even slower growth.
So, Are We Heading for a Recession?
Nevertheless, it's too soon to say for sure whether we're heading for recession. Frankly, one quarter of economic decline is not enough to call for a slowdown, particularly when the factors could be temporary.
Indeed, even experienced economists often struggle to predict when a recession will hit.
But one thing is clear: today's policy environment isn't helping. And ongoing uncertainty about trade, inflation, and regulation has made people and companies more cautious about spending and investing.
If that uncertainty doesn't clear up soon, the risk of economic weakness and higher prices will likely grow.
In times like these, it's easy to get distracted by scary headlines or market swings. But this is precisely why having a strong financial plan matters.
When things feel shaky, your plan should be your guide.
Now is not the time to make big changes out of fear. Instead, lean on the thought and strategy that went into your long-term plan.
That kind of discipline is what helps you stay on track, especially when the road ahead feels uncertain.


Liberation Day: What to Make of the Latest Tariff Announcement
This week, the U.S. government announced new tariffs starting with a 10% tax on all imported goods starting April 5.
Some countries, like China, will face even higher tariffs as part of a plan to push for fairer trade. These changes have caused markets to react quickly, with some stocks falling sharply and investors turning to safer options like bonds.
Now, it’s natural to have questions about what this means for the economy, your cost of living, and your investments.
That’s why in this update, I’ll walk you through what’s happening, why it matters, and how to think about your next steps.
What’s Happening and Why Now?
The Trump administration is rolling out a major shift in trade policy.
Beginning April 5, a 10% tax will apply to all goods imported into the U.S., with very few exceptions.
Then, on April 9, extra tariffs will be added for about 60 countries that are seen as having unfair trade practices.
For example, goods from China could face tariffs as high as 54%.
The goal?
Reduce the country’s $1.2 trillion trade deficit and bring manufacturing jobs back to the U.S.
This plan has been in the works since the last presidential campaign, and President Trump is calling the launch “Liberation Day,” hinting that these changes could be long-lasting.
Still, other countries may push back, and that could force future changes to the plan.
Are We Headed for a Trade War or Recession?
Right now, countries like China and those in the European Union are warning that they may fight back by placing their own tariffs on U.S. goods.
That raises fears of a trade war, which could slow the global economy. But so far, no official counterattacks have been made.
Economists say these tariffs could reduce U.S. economic growth and increase inflation, meaning prices might go up.
That doesn’t mean a recession is guaranteed, though.
The last time tariffs were raised back in 2018 growth slowed but stayed positive, thanks to strong consumer spending.
These new tariffs cover more goods, so the risks are higher, but the future is still uncertain.
How Are Markets Reacting?
Markets don’t like surprises, and this announcement was a big one.
Stocks dropped as news broke, especially for companies that rely on imports, like Apple, Ford, and Nike.
At the same time, bond prices went up as investors looked for safer places to put their money. Oil prices also fell due to concerns about slower economic growth.
While this reaction feels dramatic, it’s also common.
Markets often move quickly on news before all the details are known. That’s why we stay focused on long-term investing.
Your portfolio was built with days like this in mind, and it includes a mix of assets including U.S. and international stocks, bonds, and real estate that work together to manage risk.
Will This Raise My Everyday Costs?
Possibly, but not right away.
While tariffs begin in early April, it takes time for supply chains to adjust.
Some companies may raise prices, but others might absorb the extra costs at first.
If prices do go up, it could mean an extra $1,000 a year for the average household, with increases on things like phones, cars, and appliances.
Still, these are estimates, not guarantees.
We’ll be watching how companies respond and how prices shift over the next few months.
What Should I Do Right Now?
There’s no need to take action right away.
The effects of these tariffs will unfold over time. If you’ve been planning a big purchase. like a car, it might make sense to move sooner, just in case prices rise.
For everyday expenses, consider leaving a little extra room in your monthly budget.
As for your investments, patience is key.
We’ll keep a close eye on how things develop, and we’re here if you have questions.
Nevertheless, keep in mind that reacting too quickly to headlines can do more harm than good over the long-term.
Big Takeaway
Uncertainty is part of investing, and times like these are exactly why we’ve taken a diversified, long-term approach.
I’ll continue monitoring how these tariffs play out and keep you updated along the way.
If you’re feeling concerned or just want to talk things through, don’t hesitate to reach out, I’m always here to help.
Market Update: Is it a Correction or Something Bigger?
What do you do when the market takes a turn you didn’t expect? Do you panic? Do you make quick decisions? Or do you take a step back and look at the bigger picture?
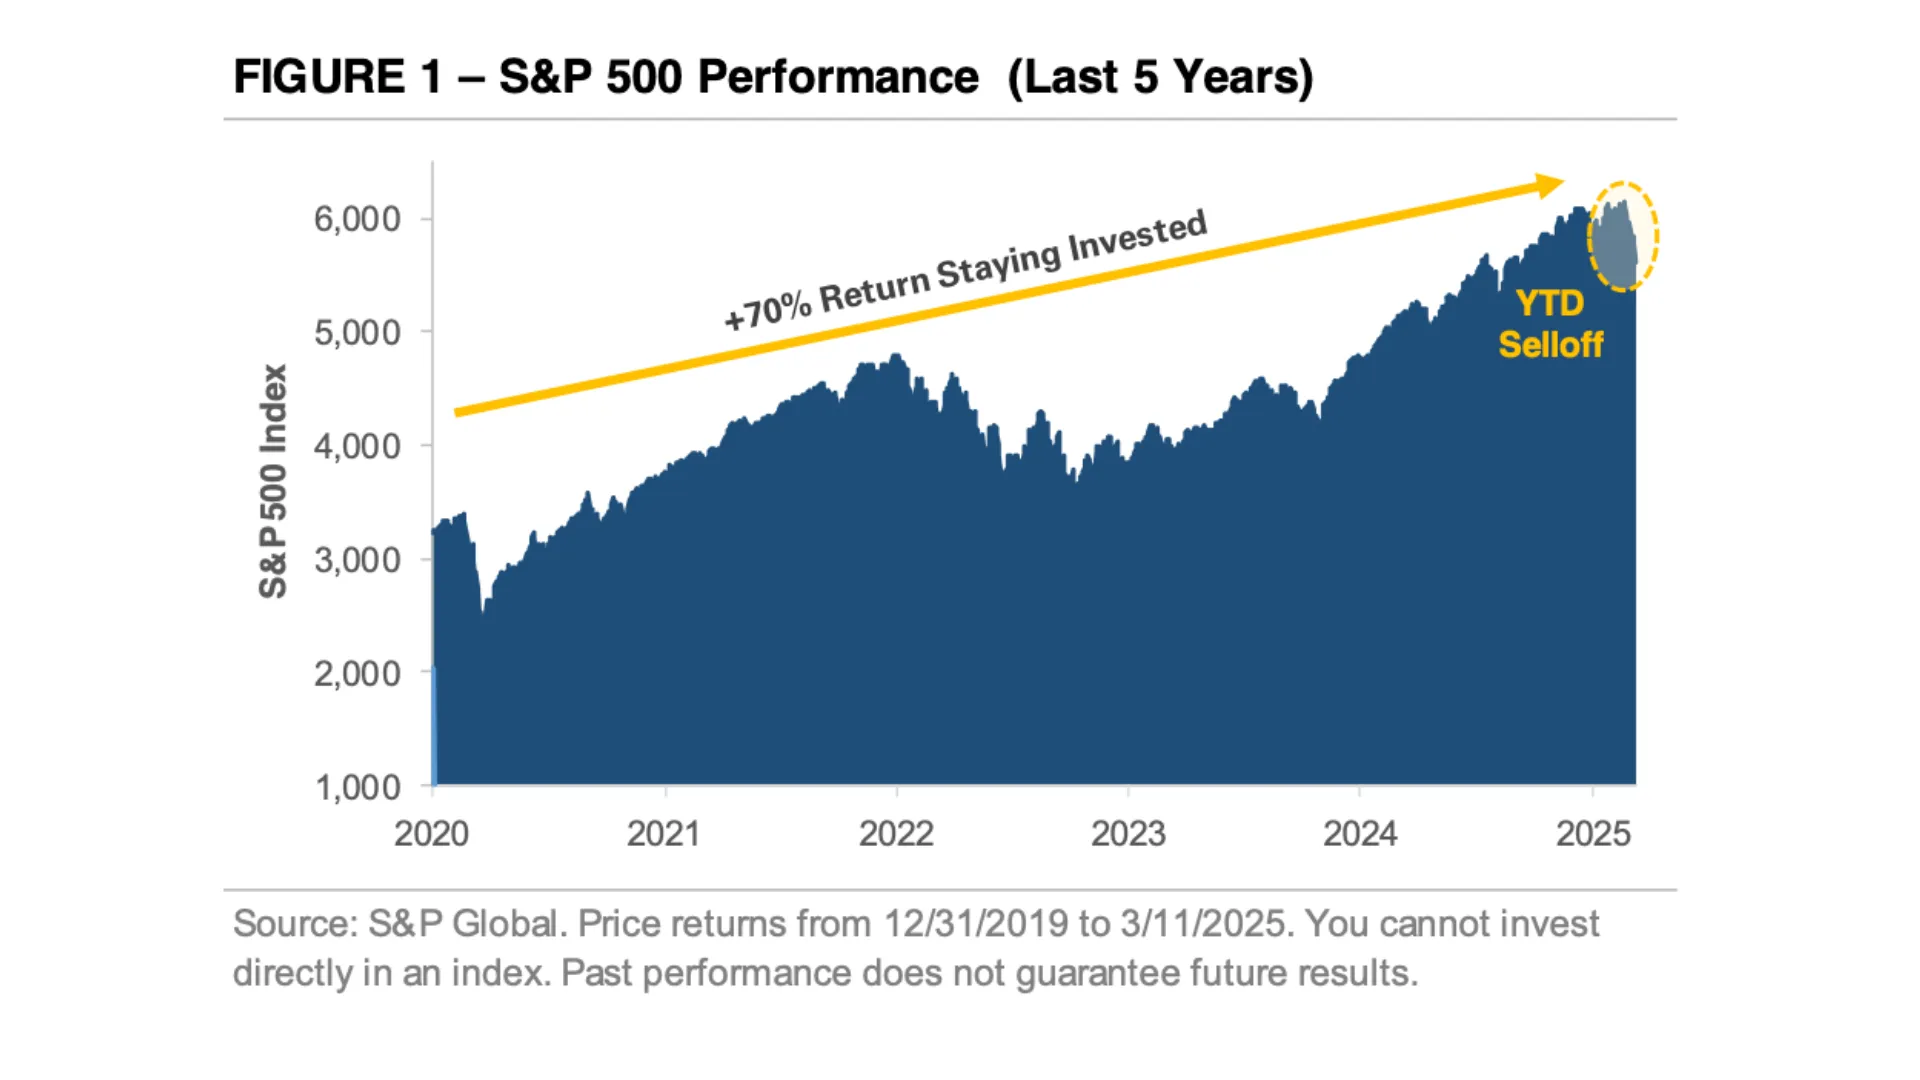
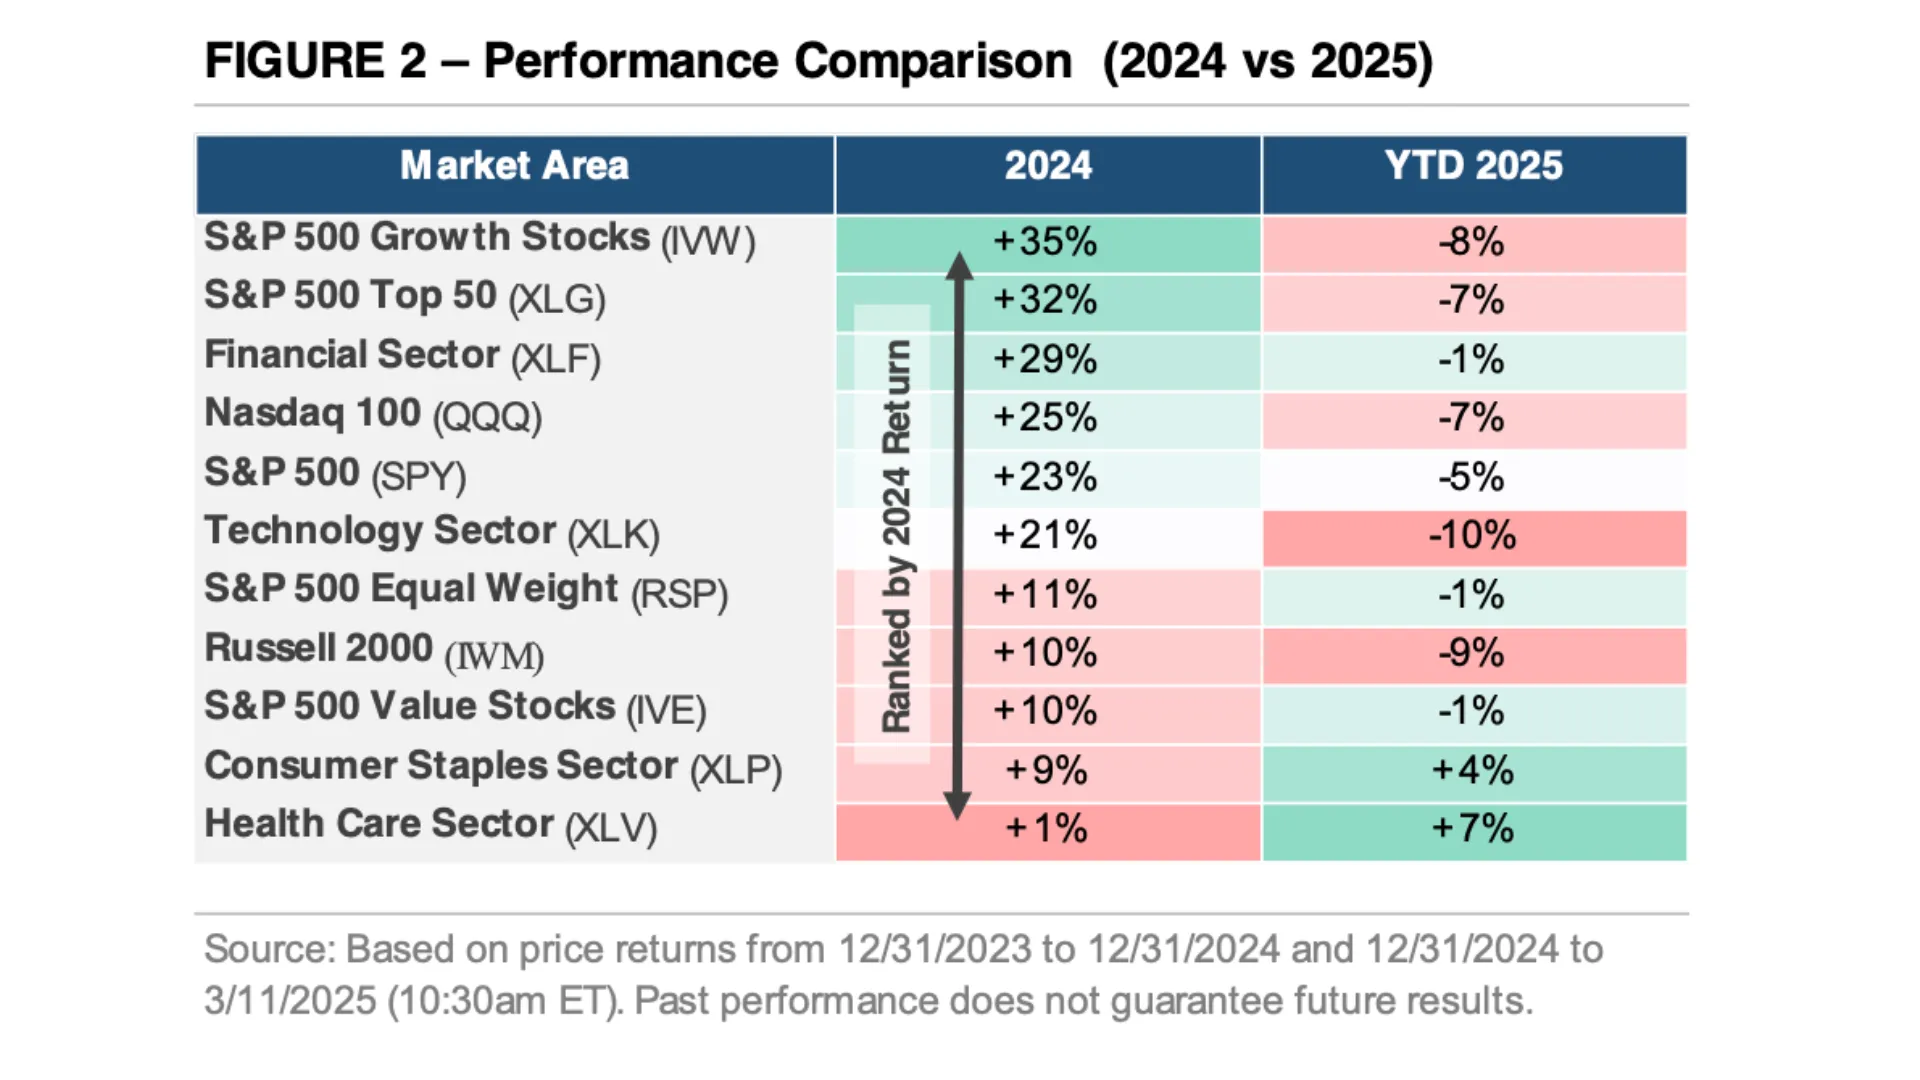
As we step into the first few months of 2025, the market has given investors plenty to think about. Stocks started the year on a strong note, but since then, we've seen a pullback. The S&P 500 briefly entered correction territory, bringing its year-to-date return down to -5%.
Similarly, the Nasdaq 100, home to some of the biggest names in tech, is down 7% this year, while the small-cap Russell 2000 has fallen 9%. And the what about the Magnificent 7 of Microsoft, Apple, Meta, Alphabet, Amazon, Nvidia, and Tesla? They’re down nearly 15%.
So what’s really going on? More importantly, what should you do about it?
What’s Behind the Market Selloff?
Well, it’s easy to blame market swings on one big event. But in reality, it’s rarely just one thing because there are likely a few reasons this year’s recent pullback.
First, the stocks that led the charge last year are the ones struggling the most today. And it’s not unusual to have yesterday’s winners become today’s laggards. Indeed, figure 2 shows us that the biggest winners of 2024, like tech stocks and the Magnificent 7, have become 2025’s underperformers.
Why?
Because last year’s rally was built on enthusiasm, especially around artificial intelligence. And when enthusiasm drives prices higher, valuations get stretched. Investors pile in, positioning gets crowded, and eventually, the weight of that momentum starts to break down.
That’s what’s happening now.
Second, investors, both individual and institutional, came into 2025 with a high level of exposure to stocks. In fact, some of the largest institutional investors like pension funds, endowments, and insurance companies held a record share of their wealth in equities.
And that strategy works well when markets are climbing, but when momentum reverses, institutional investors start deleveraging. And when they unwind positions quickly, it amplifies the selling pressure.
Finally, there’s the policy backdrop. What started as optimism around pro-growth policies under the Trump administration has shifted to uncertainty. As we’ve written about before, concerns about spending cuts and the impact of tariffs have raised questions about economic growth.
Because the fact of the matter is that investors don’t like uncertainty, and right now, they’re adjusting to a new, highly uncertain reality.
Market Volatility vs. Economic Reality
So, does all this mean the economy is struggling? That’s a great question. And here’s where we need to separate perception from reality.
The stock market reacts quickly to new information, but that doesn’t always mean the economy is following the same path. One way we can test that is by looking at real-time economic data.
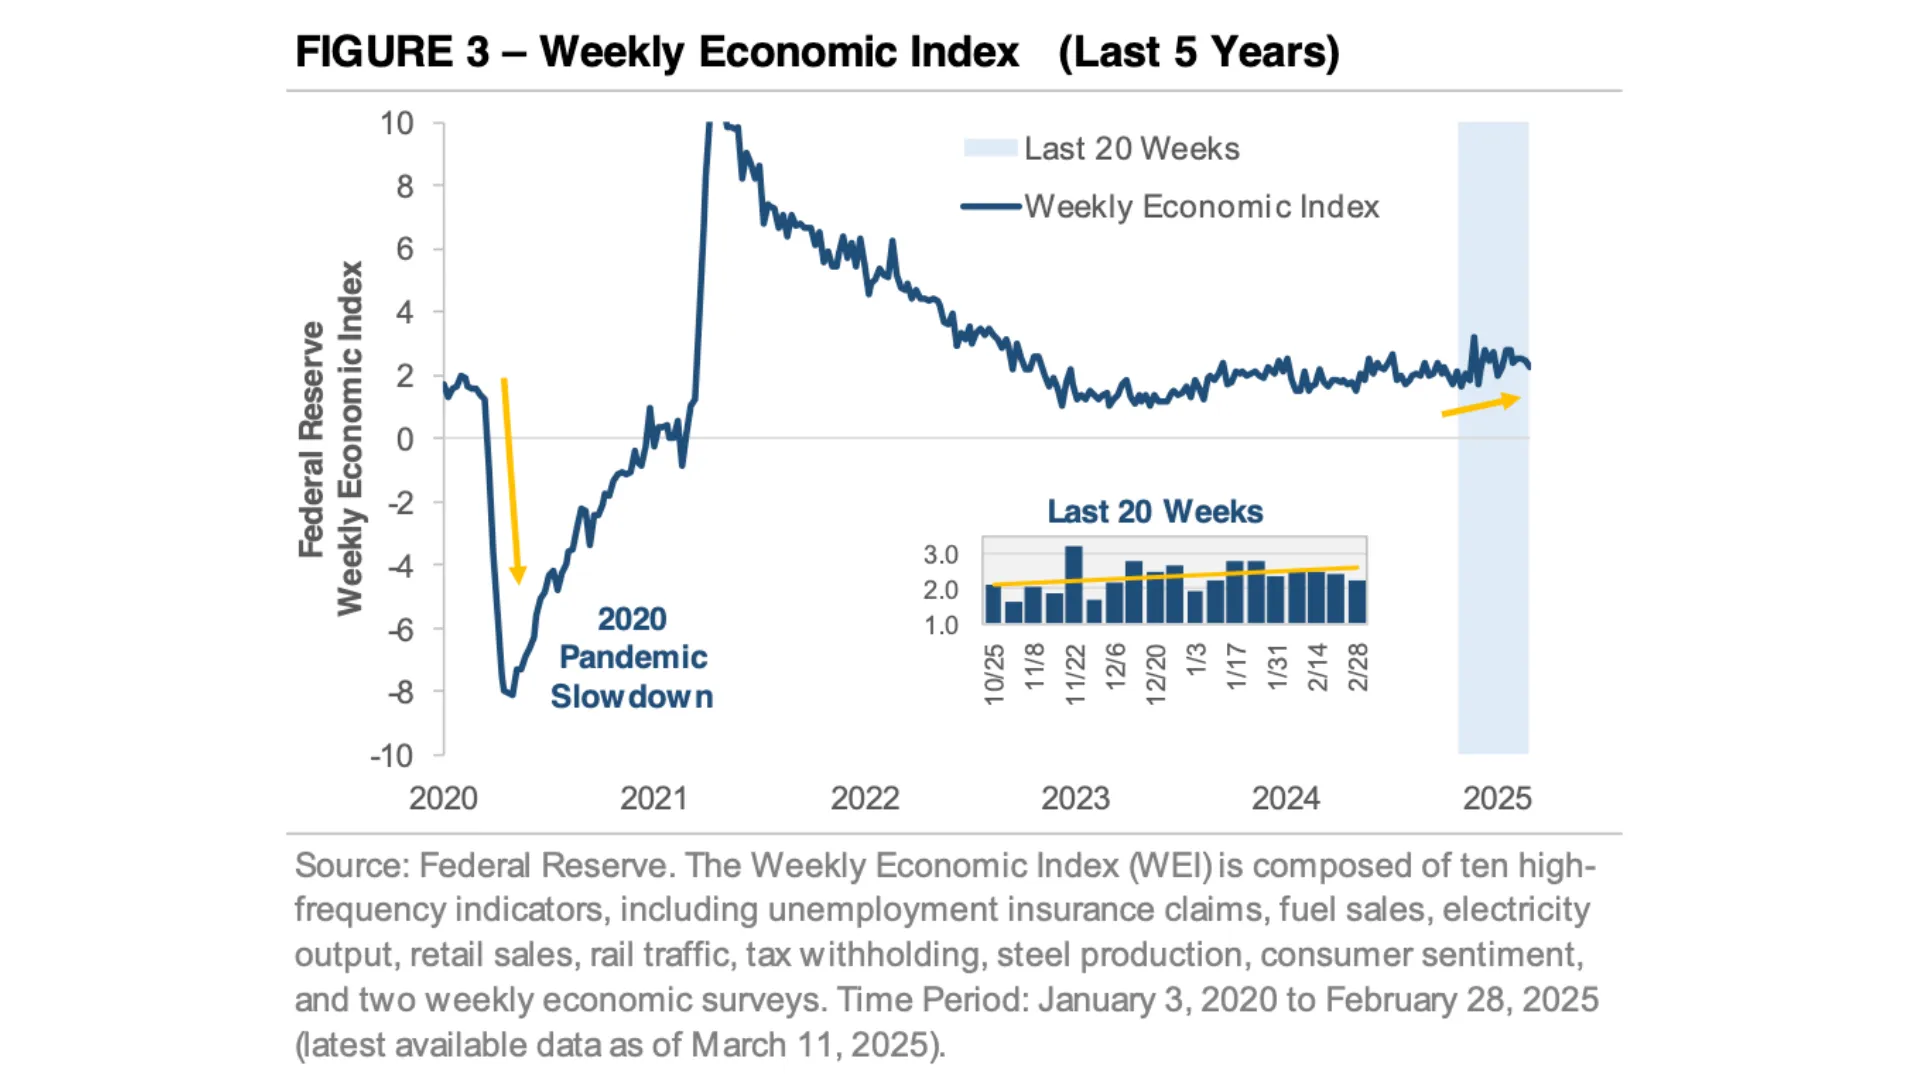
For example, the Federal Reserve’s Weekly Economic Index (WEI) tracks real-world activity using data points like unemployment claims, rail traffic, steel production, and tax withholdings.
And right now? It’s still positive (Figure 3).
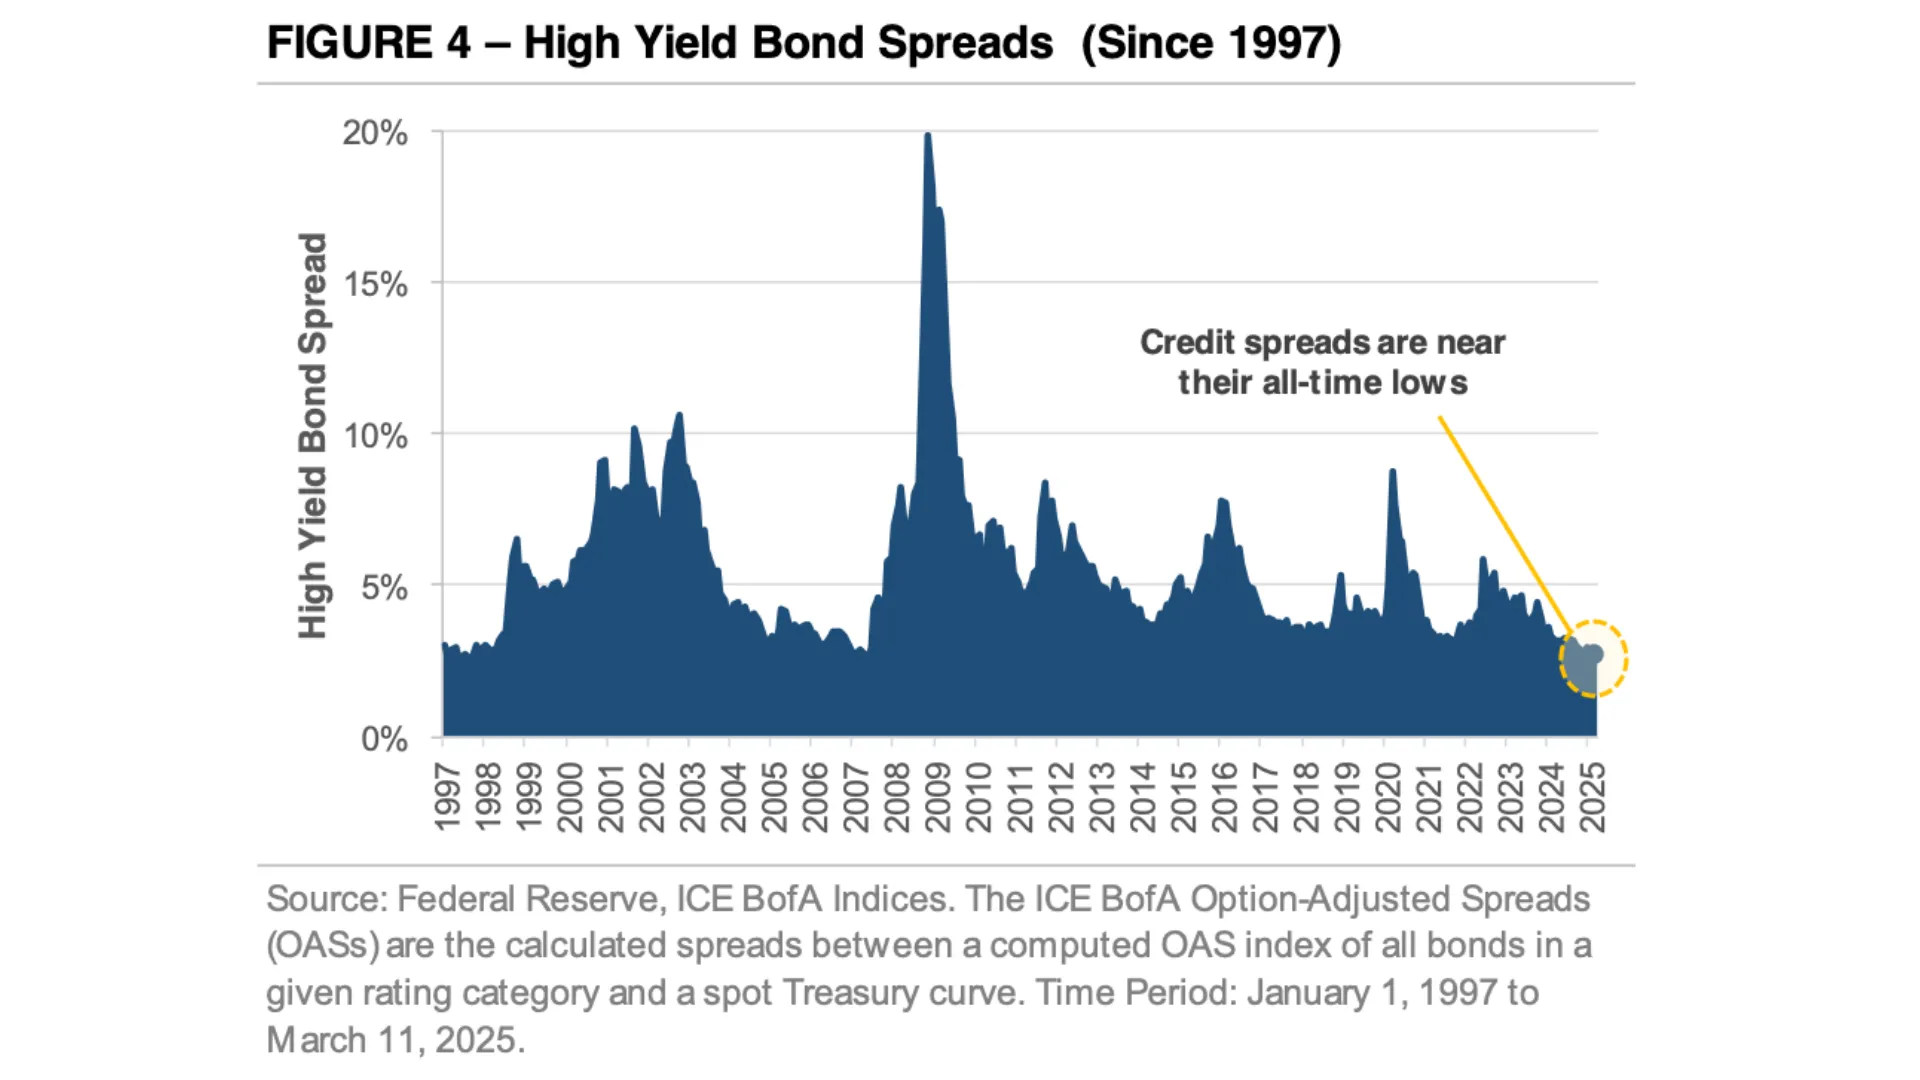
Another piece of the puzzle is the bond market. High-yield credit spreads, which are essentially the difference in yield between risky corporate bonds and safer U.S. Treasuries, are a great way to measure financial stress.
And today, those spreads remain near all-time lows (Figure 4). Indeed, if we were facing a deeper economic problem, we’d expect to see those spreads widen. The fact that they haven’t tells us this market selloff could be more about repositioning than it is about a fundamental crisis.
With that said, no one rings a bell when we’ve entered a recession. And it’s very well possible that a policy error from the current administration could push the economy into a downturn. For now, however, the data continue to reflect modest economic growth.
Is This Normal and Can the Market Selloff Continue?
Now, if you’ve been investing for a while, you likely know that market volatility isn’t new. But let’s be honest, knowing that doesn’t make it feel any better when stocks drop, does it?
So what should you do?
Well, one of the best things we can do is put this moment in perspective. For example, since 1928, the S&P 500 has experienced a decline of 5% or more in 91 of the past 98 years.
Read that again.
In almost every year on record, we’ve seen the market pull back like this. And yet, time after time, markets have recovered. Investors who stay the course, who focus on the long-term, are the ones who have been rewarded.
So let me ask you: What’s your plan?
Because the difference between reacting and responding is having a plan. The key isn’t trying to predict every market move. It’s making sure you’re positioned to succeed no matter what happens next.
And that’s why sticking to a disciplined process and having a long-term perspective matter over the long-run.
The Bottom Line
Market volatility often feels personal. It’s your retirement savings on the line, isn’t it?
And so, when you see headlines about market swings, it’s easy to wonder, “Is this the beginning of something bigger? Am I missing something? Should I be doing something differently?”
So then, if that’s where your mind is right now, you’re not alone.
But more importantly, you’re not powerless. You don’t have to let fear dictate your financial future. You can make decisions based on a thoughtful strategy rather than short-term emotions.
Whether you’ve been working with our team for years or you’re just starting to explore your options, here’s what I want you to hear: clarity, confidence, and peace of mind don’t come from guessing the market’s next move. They come from knowing you have a plan that’s built for moments like this.
Because at the end of the day, the market will move up.
It will move down.
That’s a given.
But those who stay focused on the long term, those who stay diversified and patient, won’t just weather today’s volatility. They’ll be in the best position to thrive beyond it.
So, the real question isn’t what will the market do next? The real question is: Are you ready for whatever comes next?
The Market Feels Unstable — Here’s How to Stay on Track
There are times in market cycles when economic, geopolitical, and financial conditions converge in ways that create palpable uncertainty. In many ways, it can feel like standing on the precipice of an abyss.
Today, I would argue that we are in just one of those moments.
Often, it’s not just one event, but a cascade of interconnected developments that lead one to conclude that things are about to get bad.
History Often Rhymes
Early on in my career, it started with the failures of Bear Stearns and Lehman Brothers, the nationalization of Fannie Mae and Freddie Mac, and the bailouts of AIG and Citi, all of which signaled the fragility of the global financial system in 2008.
In 2020, early reports of health warnings, travel restrictions, and border closures eventually escalated into a near-total shutdown of the global economy, prompting widespread existential fear.
Now, in early 2025, we are experiencing heightened uncertainty as the resumption of trade wars with ambiguous objectives, shifting geopolitical alliances, and a retreat from post-war global institutions and a seeming move towards isolationism create a new political and economic reality. These shifts pose significant implications for the global economy and financial markets.
Needless to say, there is much to worry about in the current political, economic, and market environment. It’s enough to make any sane person want to bury their savings in their backyard.
How to Navigate the Uncertainty
That said, having been through multiple market cycles, being an avid student of history, and considering my background in macroeconomic strategy, I would like to share some thoughts on how to frame today’s environment and what you can do about it financially.
Firstly, I want to acknowledge that we are in the midst of an anxiety-provoking time in U.S. history. I am not going to discount the legitimate fear that many of us may be feeling right now amidst all the political tumult and economic uncertainties. This is a natural response.
With that said, when it comes to investing and the markets, it’s crucial to remember that we’ve been through similar challenges in the past. And with history as our guide, during times like these, it’s essential to remain committed to a long-term, disciplined investment strategy.
Make no mistake, what’s happening today will have significant implications for years to come.

Why It’s Essential to Stay Committed for the Long-term
However, history has shown that, from a capital markets perspective, risk assets tend to sell off during political and economic inflection points, before eventually recovering. These ebbs and flows are a natural part of the market process when key narratives change.
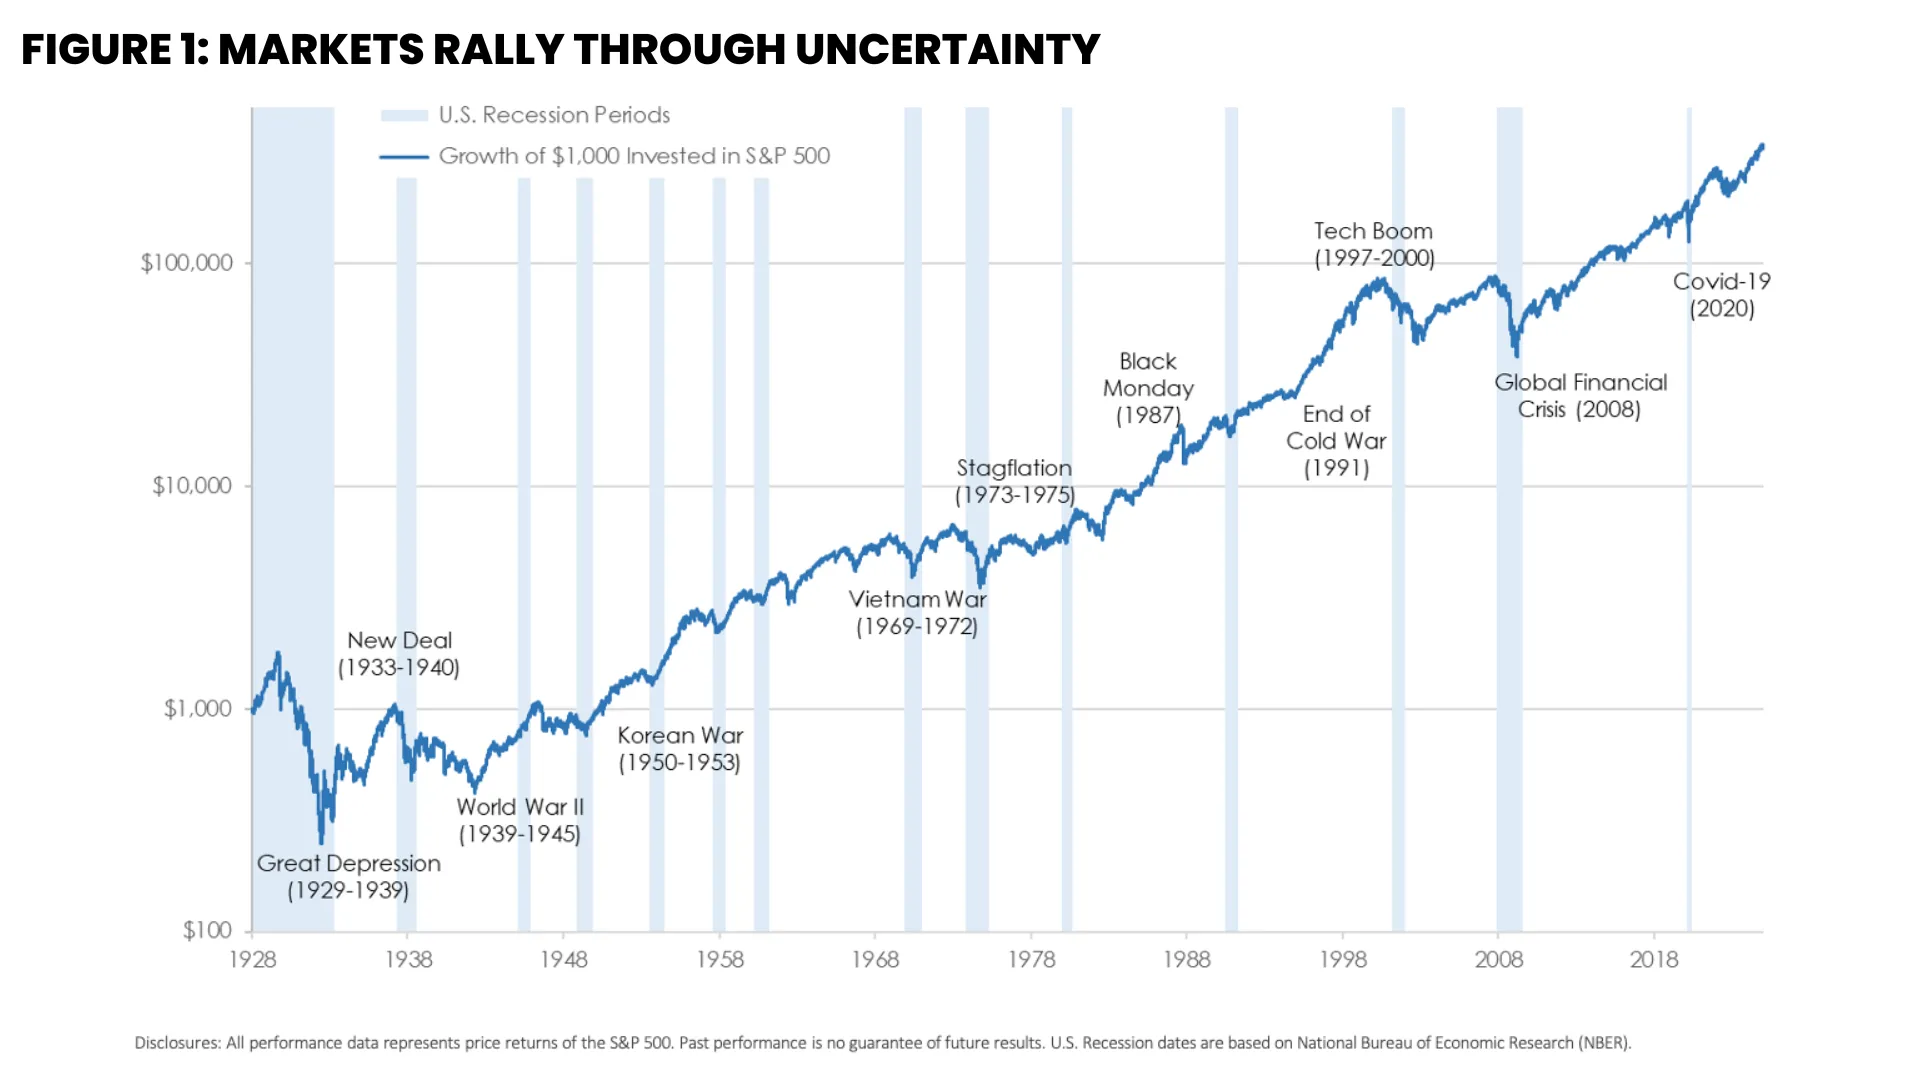
In fact, over the past 100 years, there have been many paradigm-shifting political and economic events, but stock prices continued to march higher thereafter. This point is evidenced in Figure 1.
To be sure, financial markets, after periods of uncertainty, do eventually recover as investors eventually adapt to new political or economic paradigms. Indeed, as figure 1 illustrates, risk asset prices are naturally biased to the upside because if they weren’t, then investing would not be much different from gambling, would it?
Nevertheless, you might say that now is not the right time to be in the markets and that you would prefer to get out. However, history has also shown us that exiting the markets at the wrong time could lead to major disappointment down the road.
For example, Figure 2 shows how missing even the best five days over the past 20 years could have led to significant missed opportunities in the markets. Indeed, back in 2008, it is arguable that peak market fear occurred at the end of the year, just a few months before the market bottomed out in March 2009.
Similarly, in 2020, peak fear occurred in late February before markets bottomed out in March and then took off again in April. Therefore, trying to time the markets or get out when it feels like things are starting to get bad might work against you over the near- and long-term.
Practical Steps to Take
So then, amidst all of this, what should you do about it all?
Well, in uncertain times, many investors often find themselves torn between taking action and standing still.
Here are six key strategies to consider regardless of where you stand today:
#1 Know Your “Sleep Well Number” (Cash Management)
When it comes to cash management, during times like these, it is crucial to know your “sleep-well” number. Depending on where you are in your retirement journey, having enough cash on hand to cover six to eighteen months of living expenses is something to consider now.
Having this number available will enable you to avoid making knee-jerk decisions with your portfolio, enable you to stay committed to your long-term strategy and avoid selling assets at an inopportune time.
#2 Rebalance Your Portfolio
Rebalancing your portfolio now allows you to take some risk off the table. Markets have rallied handsomely over the past eighteen months, which means that your current holdings are very likely out of alignment with your strategic asset allocation.
Rebalancing includes taking gains from positions that have done well in your portfolio and adding to positions that are underallocated in your portfolio relative to your strategic allocation. This approach ensures that you’re not taking any more risk than necessary with your investments.
#3 Stick to Your Long-term Plan
When in doubt, stick to your plan. Remembering your long-term plan is essential during market uncertainty. That’s because it is easy to become distracted and search for a salve to relieve the unease in the near term when things start going off the rails.
However, it’s crucial to remember that your financial plan was created to help you navigate not just the good times, but also uncertain times like the ones we’re experiencing today.
#4 Reconsider Big-Ticket Purchases
If you are contemplating purchasing a new home, car, or other big-ticket item, you may want to consider holding off on any moves for the next few months. This approach will allow you to preserve cash and ensure that you are not locking yourself into a decision at an inopportune time.
#5 Sharpen Your Pencil
At the same time, it is worth sharpening your pencil. Warren Buffett is known to have said, “Be fearful when others are greedy, and greedy when others are fearful.” Depending on your living situation and cash position, fear-driven market sell-offs often provide opportunities to purchase assets at a discount.
If you are in a solid cash position, keeping an eye out for favorable buying opportunities once we have more clarity on the political and economic environment could be worthwhile.
#6 Consider Tax Planning Opportunities
Finally, market sell-offs also present an opportune time for tax planning. And a key tax planning approach includes completing a Roth conversion. That’s because lower portfolio values often translate to lower taxable values. Remember, Roth conversions are not just a fourth-quarter tactic but a year-round opportunity.
Similarly, market downturns can present opportunities for tax-loss harvesting. This approach involves selling stocks at a loss and buying a similar but not identical asset. Even if you do not have gains to offset the losses, you can carry forward the losses as a tax asset to offset future capital gains.
The Big Takeaway
When it comes down to it, the big takeaway from an investment perspective is to stay invested for the long term even though the near term seems so uncertain. While we may be headed for a dark period in the months ahead, I am reminded of how essential it is to remain optimistic.
Viktor Frankl, a Holocaust survivor and author of the book, “Man’s Search for Meaning”, points out in his work that those who adapted and sought meaning in each moment, especially in trying times, had greater ability to endure trials and uncertainty than those who did not.
Make no mistake, we are likely headed for some very trying times in the weeks and months ahead. From a political and social perspective, we do not have a roadmap for navigating what lies ahead, which means we will have to take things one moment at a time. As difficult as that may be, however, finding purpose and direction in uncertain times has always been a defining trait of those who successfully emerge from such events.
What’s more, from a financial perspective, history has repeatedly shown that uncertain times like these often create opportunities for those who stay the course. That’s why having a solid financial plan and a disciplined investment strategy is essential now more than ever. While the near-term outlook may be uncertain, remaining objective and committed to a well-thought-out financial plan continues to be the best way forward.
Fed Policy: Are Rates Poised to Head Higher or Lower in 2025?
Are interest rates headed higher or lower in 2025? Well, it likely depends on the incoming data.
Indeed, not long ago, the Federal Reserve launched one of the fastest rate-hiking cycles in history as it was determined to bring inflation down from a multi-decade high. After keeping rates elevated for more than a year, the Fed shifted course in late 2024, cutting rates by a full percentage point between September and December.
Today, however, policymakers appear to be taking a "wait-and-see" approach as incoming data present conflicting stories.
The Fed's Balancing Act: Inflation vs. Employment
Now, to understand where things stand, it helps to remember that the Fed has two main responsibilities.
First, it aims for price stability, which means keeping inflation low and predictable. Second, its job is to seek out full employment, ensuring conditions that encourage job growth while keeping unemployment in check. The challenge today is that these two goals don't always align perfectly. And right now, the balance between them is changing.
How so?
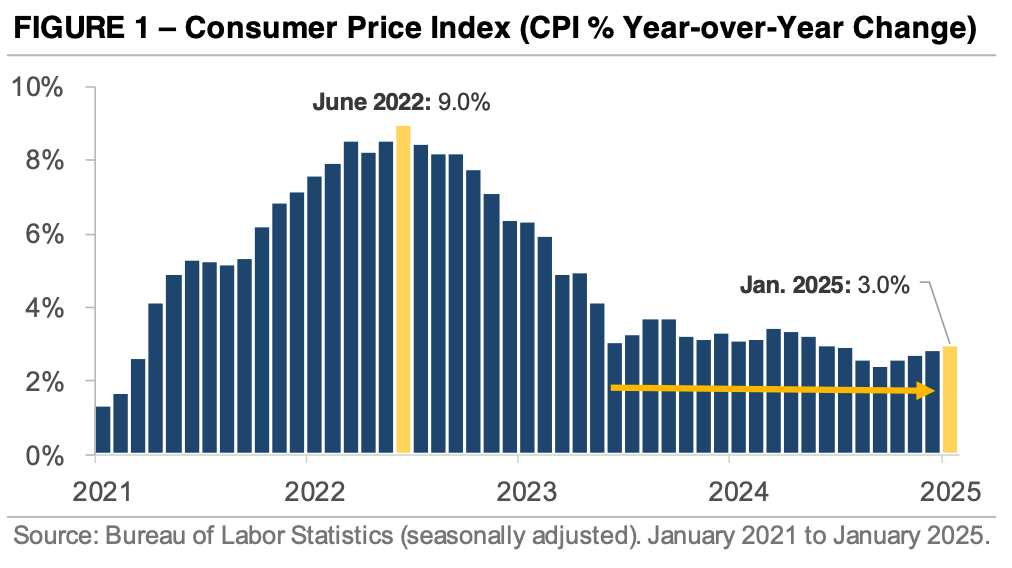
Well, consider inflation. The chart in Figure 1 tracks the year-over-year change in the Consumer Price Index (CPI), which measures how the prices of everyday goods and services fluctuate. Throughout most of 2024, inflation had been steadily declining.
However, in January 2025, inflation picked up again. CPI rose 0.5% from the previous month, marking the largest increase since August 2023. As a result, the annual inflation rate inched up to 3.0%, slightly above December's 2.9%.
And while inflation has come down significantly from its peak of nearly 9% in mid-2022, progress has stalled in recent months. Indeed, since late 2023, CPI has hovered around 3%, raising concerns that inflation could remain above the Fed's 2% target for an extended period.
Conflicting Jobs Data
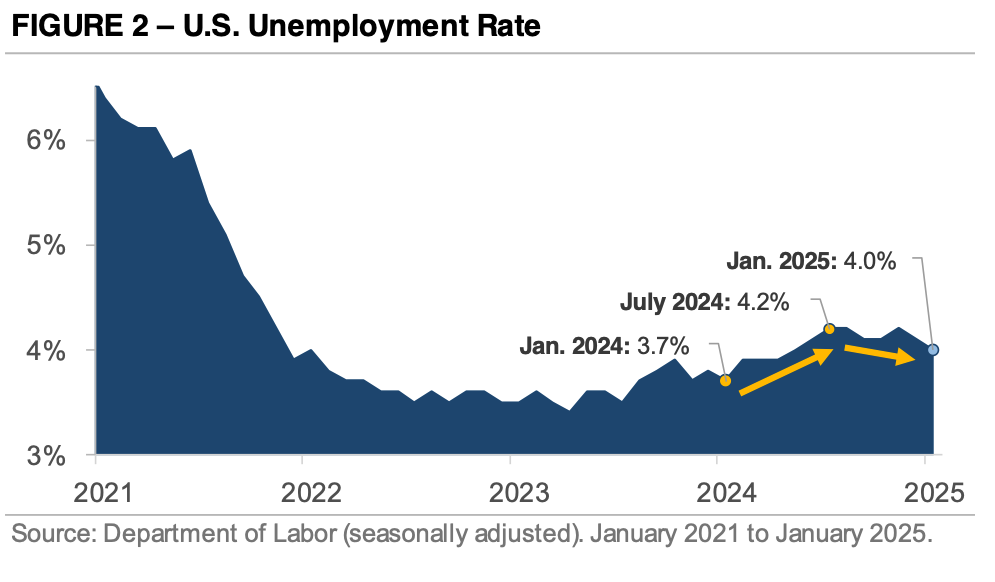
At the same time, the labor market continues to show resilience. Figure 2 highlights the U.S. unemployment rate, which remains strong by historical standards.
In fact, in January, unemployment edged lower to 4.0% which is the lowest its been since May 2024. To be sure, while employers added 143,000 jobs that month, which was a slower pace compared to the post-pandemic hiring boom, it was nevertheless a sign of steady demand for workers.
At the same time, job numbers from November and December were revised higher, revealing that the economy created 100,000 more jobs than initially reported.
And this has been problematic for the Fed given that just a few months ago, policymakers pointed to rising unemployment as a reason to begin cutting rates. However, recent data suggests that the labor market is not weakening as quickly as many had expected.
What Does this Mean for Interest Rates?
So, what does this mean for interest rates?
Well, in 2024, the Fed started cutting rates to shift its focus from controlling inflation to supporting job growth. However, now that inflation progress has stalled and the labor market remains stable, many believe the Fed will pause further rate cuts until it has more clarity.
In fact, at its January 2025 meeting, the central bank chose to keep interest rates steady after three consecutive cuts. At the same time, Fed Chair Jerome Powell reinforced this cautious stance, explaining that there is no immediate need to rush into further adjustments.
What Should You Do About It?
Looking ahead, there are signs that market expectations have shifted.
To be sure, instead of anticipating another rate cut in the early months of the year, many now expect the next adjustment to come in June 2025. However, the real question remains: Will inflation continue to cool, or will the Fed need to rethink its strategy once again?
With the political climate shifting, budget cuts looming, and both households and businesses feeling more cautious, the Fed's decision to pause may not be a sign of confidence but rather a reflection of uncertainty.
Could inflation take another leg down if demand slows further? That remains to be seen. But more importantly, what does all of this mean for your investments?
Right now, it's very well likely that we're in a period of transition. The economy is adjusting, and markets are searching for direction. But if history has taught us anything, it's that trying to predict where markets will go in the next 12 months, or even the next 12 weeks, is rarely a winning strategy.
Indeed, over the past five years, market behavior has looked very different from the decade before.
The Big Takeaway
So, what should you focus on instead?
Well, one thing that hasn't changed is the value of a well-diversified portfolio. While markets shift and economic conditions evolve, diversification remains one of the best ways to manage risk. This approach ensures that no single event, no single policy decision, and no single downturn can completely derail your long-term progress.
Either way, here's the big takeaway: There is still plenty of uncertainty surrounding inflation, interest rates, and the economy. While some indicators point to slower growth ahead, the wisest approach isn't to react to every twist and turn.
Instead, it's to stay disciplined, stay focused, and stay committed to your long-term plan. Now more than ever, doing so will keep you from being caught off guard no matter which way the markets move next.

Changing AI Leadership, Trade War 2.0 and Market Volatility
Monthly Market Summary
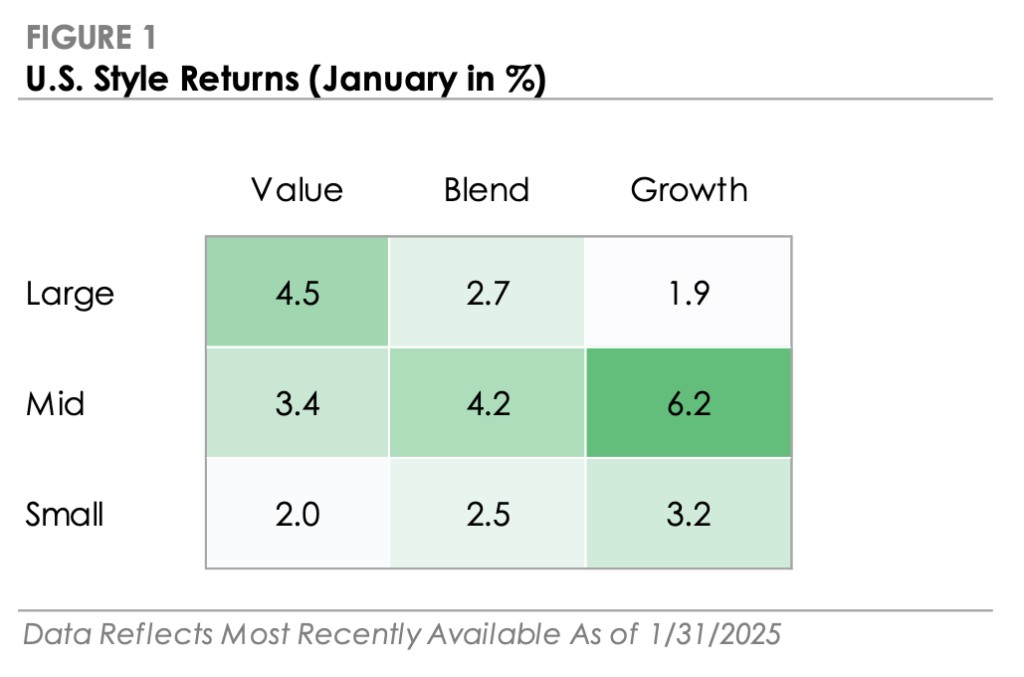
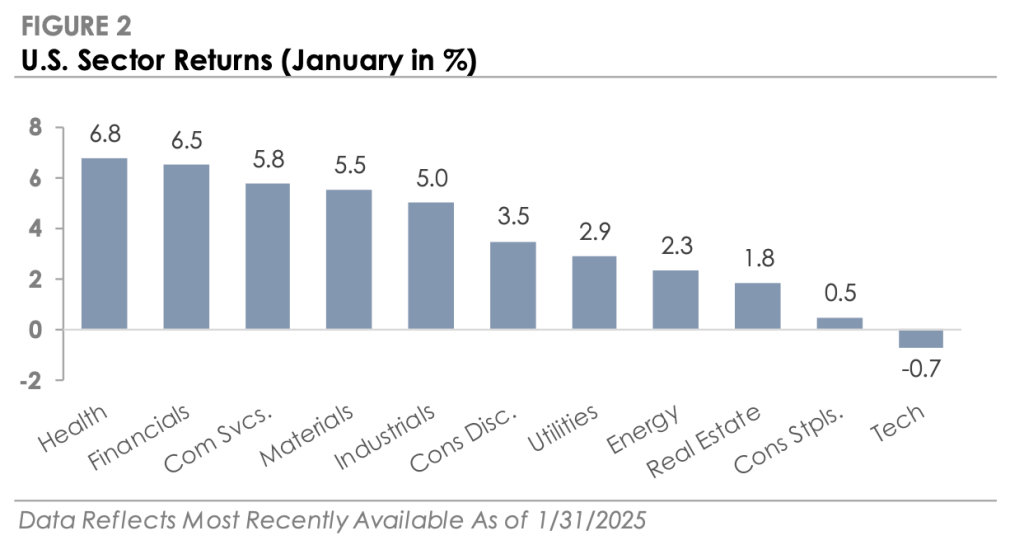
- The S&P 500 Index returned +2.7% in January, marginally outperforming the Russell 2000 Index’s +2.5% return. Seven of the eleven S&P 500 sectors outperformed the index, as AI-related news led to a sell-off in Technology stocks.
- Corporate investment-grade bonds produced a +0.6% total return as Treasury yields edged lower but underperformed corporate high-yield’s +1.4% total return as corporate credit spreads tightened further.
- International stock returns were mixed. The MSCI EAFE developed market stock index returned +4.8% and outperformed the S&P 500 due to strength in Europe, while the MSCI Emerging Market Index returned +2.2%.
Changes in Market Leadership
One month into the new year and markets have continued to rally; however, renewed geopolitical uncertainties could pose challenges to solid market gains. Indeed, after a strong showing in 2024, stocks traded higher to start 2025, but the factors driving the rally took on a different character in the past month than we have seen over the past year. For example, the segment of stocks that powered the recent market gains, Large Cap Value stocks, had lagged over the past year but outperformed Large Cap Growth by more than 2.5% in January.
At the same time, the Dow Jones Industrial Average climbed back toward its all-time high in early December after closing last year on a weaker note. Meanwhile, growth stocks, as measured by the Nasdaq 100 and the Technology sector in general, which led markets higher for most of 2024, underperformed the broader index for the month.
This shift was largely driven by AI-related developments in China, which raised concerns about U.S. dominance in the sector and broader market trends. What this means is that while tech stocks powered last year's gains, other sectors may take the lead in 2025, especially if geopolitical risks remain contained. This kind of shift in leadership is not uncommon following strong market years, as investors look to rebalance portfolios and identify opportunities in areas that were previously overlooked.
Are Tech Stocks Out of Steam?
So then, is tech as a driving force of the current rally down for the count this year? It might be too soon to tell. Indeed, January saw a major shake-up in artificial intelligence (AI), with ripple effects across U.S. markets. That's because Chinese startup DeepSeek introduced an AI model that claims to be able to compete with top U.S. platforms like ChatGPT but at a fraction of the cost. The model was allegedly developed using less advanced and cheaper chips, challenging the assumption that leading AI models require heavy investment in high-performance computing. If this approach catches on, it could significantly alter the industry and affect U.S. leadership in AI.
That's why markets reacted quickly, and the impact was significant, leading to a selloff in U.S. tech stocks, especially those that had seen strong gains on AI growth expectations. That's because the prospect of lower-cost AI development raised concerns about the demand for high-end chips. So then companies like Nvidia, a key supplier of advanced AI hardware, saw its market capitalization fall by nearly $600 billion, which was one of the most significant single-day losses for a U.S. company.
At the same time, the selling pressure extended to Microsoft, Alphabet, and Meta, as investors reassessed what appears to be rich valuations in the AI space. And this market response likely reflects broader worries that progress in the AI space may not be as capital-intensive in the future as once believed, which could challenge the dominance of companies that have benefited from high investment requirements in AI-related infrastructure.
Even so, what's notable here is that although the initial market decline was concentrated in a handful of companies, their heavy weighting in the S&P 500 dragged the broader index lower. Nevertheless, investor sentiment is rarely one-sided, and after the initial selloff, markets stabilized coming into February as some investors viewed the pullback as a buying opportunity, particularly in areas of the market that may benefit from AI-driven cost efficiencies. Still, given AI's significant role in market performance, markets will be keen to keep a close eye on developments in the sector while rebalancing to other market opportunities.
Trade War 2.0 Developments
Changes in trade policy also added another layer of market uncertainty after a solid start to the year. That's because, on February 1, 2025, President Trump announced new tariffs as part of what some are dubbing "Trade War 2.0": 25% on imports from Mexico and Canada (with a 10% levy on Canadian energy products) and 10% on Chinese imports. The move is positioned as an effort to address trade imbalances and immigration concerns and prompted immediate responses from major trading partners. Even so, Canada and Mexico secured temporary delays while committing additional resources to combat organized crime and drug trafficking.
But, China responded swiftly, imposed tariffs on U.S. coal, liquefied natural gas, crude oil, and agricultural machinery while launching an antitrust probe into Alphabet. The reaction in financial markets was immediate, with major indices dropping over 1% and the U.S. dollar reaching a 20-year high against the Canadian dollar. Markets have since recovered modestly since the initial selloff, but the surge in the dollar could have additional implications for U.S. multinational companies, as a stronger currency can weigh on exports by making American goods and services more expensive overseas.
These developments reinforce the risks of an escalating trade war, which could lead to higher inflation, supply chain disruptions, and slower economic growth in affected regions. And while markets have endured trade-related tensions in the past, the unpredictability of policy responses are likely to keep investors on edge, especially as incoming data suggests that economic growth is moderating.
Looking Ahead
So, what does this mean for your portfolio? Well, over the next few months, investors will be watching trade policy developments, AI innovation, and Federal Reserve decisions for signals on market direction. While the broadening of market leadership suggests a more balanced rally, geopolitical and macroeconomic risks remain a central headwind to any potential market rally.
Here's the big takeaway: This complicated environment makes it especially important for investors to avoid reacting too strongly to short-term headlines.
Indeed, it's essential to remember that markets don't move in a straight line, and with AI disruptions and trade tensions shaping 2025, staying committed to your long-term plan will be key. Because the question isn't just how these forces play out, it's how you position yourself in response.
Therefore, taking a proactive approach to portfolio positioning, especially rebalancing your investments rather than being swayed by short-term volatility, will be critical to navigating market volatility.
Either way, how political and economic events unfold will shape the market's trajectory. But for now, the best strategy is to focus on your disciplined investment strategy, ignore the noise, and ensure your financial plan is positioned to give you clarity, confidence, and peace of mind as you move through another period of economic and market uncertainty.
Market Update: A Look Back at April's Market Drama
Have you ever noticed how quickly fear can spread in the financial markets? Or how a headline can send shockwaves through risk assets in a matter of hours?
That's exactly what happened in early April.
And it happened because the White House announced sweeping tariffs, escalating the Trade Wars and just like that, the S&P 500 dropped more than 10% in a single week.
Of course, investors panicked, and uncertainty took center stage.
But then, just as quickly as the fear appeared, it seemingly faded. The administration paused those tariffs, cooler heads began to prevail and by the end of the month, the market had clawed its way back, finishing April with a loss of less than one percent.
The bond market was a completely different story. That's because interest rates didn't know which way to go.
Indeed, they bounced around all month long, responding to every new headline and every ounce of economic doubt. But despite all the noise, they ended up right where they started, flat for the month.
Why Is Policy Driving the Markets?
Now, if you've been wondering what's really moving the markets this year, it all boils down to policy uncertainty.
The truth is that the rules of the game are changing as the direction out of Washington is shifting.
And when the future feels uncertain, people pause, businesses wait and consumers tend to hold back.
At the same time, market participants begin to take notice and start asking, "Is this the start of something bigger?"
Certainly, we've already seen the impact in some corners of the economy. Some consumer demand was pulled forward earlier in the year due to tariff concerns.
But now, there's a hesitation as surveys show that businesses and households are beginning to delay big spending and investment decisions because no one wants to make a move when the rules of the game might change tomorrow.
What's Going On with Stocks?
So then, what has this meant for stocks? Well, the fact of the matter is that what we're seeing in the markets today is when yesterday's winners stop winning. Indeed, the mega-cap Magnificent 7 tech stocks that dominated last year are down more than 15% in 2025 after soaring over 60% in 2024.
Even so, that doesn't mean all stocks are struggling because many investors have already begun shifting their focus to defensive sectors like Utilities, Consumer Staples, Health Care, and Real Estate.
And even though the S&P 500 is down more than five percent, these sectors are showing strength because, in uncertain times, people look for stability.
What's even more striking here is that for the first time since 2023, international stocks are leading the way. In fact, the first quarter was one of their best showings in over two decades.
So then, if you've been ignoring markets outside the U.S., now might be a good time to pay attention.
What About Bonds and the Fed?
And how have bonds done this year? Well, these markets have not been immune from the heightened level of volatility.
Indeed, Treasury yields have been jumping in response to, tariffs, debt concerns, inflation risks, and that ever-present cloud of uncertainty.
At the same time, corporate credit spreads, or the premium that investors demand above holding "safe" investments, have started to widen again.
That's making riskier high-yield bonds less attractive because investors are pricing in the unknown as they're preparing for a wide range of outcomes, and that's exactly what causes volatility.
Now, in the midst of all this volatility, the Fed is waiting patiently on hold. Rate cuts haven't started yet, but the market is betting that the first one will come in June. And not just one, but multiple cuts are now expected by the end of the year.
But that, of course, depends on how the economy holds up and how inflation behaves in the months ahead.
So What Does This Mean for You?
So, what should we make of all of these developments?
Well, the bottom line here is that markets threw a tantrum in April as policy uncertainty stirred the pot.
And for a moment, it felt like everything was up in the air.
But the fact of the matter is that this is what markets do when the path ahead feels unclear.
They test convictions, they expose cracks and they remind investors that uncertainty is the cost of admission for long-term growth.
Nevertheless, uncertainty doesn't have to equal instability.
Because if you have a clear purpose, a thoughtful plan, and a disciplined process for staying on track, then these moments become less about reacting and more about reaffirming what you already know to be true.
That's why now may not be the time to chase returns or make sweeping changes to your investment portfolio.
Even so, it may be the perfect time to revisit your strategy, reassess your positioning, and evaluate whether your plan is built for this kind of environment.
If you're not sure, let's have that conversation.
Because you don't have to predict the future to prepare for it, you just need to know what you own, why you own it, and what to do next.
That's what we help our clients do every day.