

Weekly Market Update: The Bigger Picture Behind July's Turn
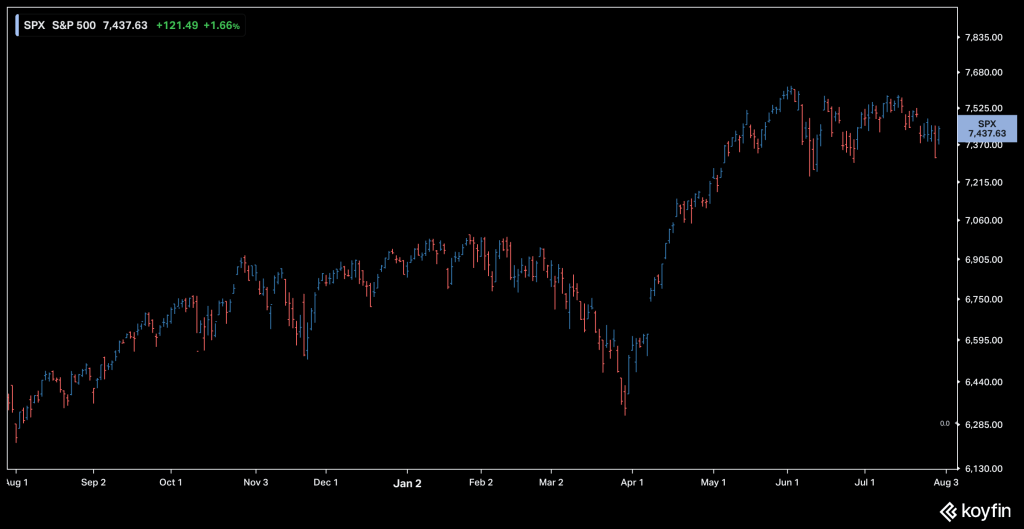
July delivered the third major shift in financial markets this year, following the turns in March and April. The AI and semiconductor trade that had led all year reversed sharply, sliding into a bear market as investors moved from rewarding capital spending to scrutinizing it.
At the same time, the re-escalation of the U.S.-Iran conflict reopened the channel that runs from oil to inflation to Fed policy. Major indices pulled back from record highs, the VIX drifted toward 20, and the Fed turned more hawkish. The damage, though, has been relatively concentrated.
AI stocks have entered correction territory, but credit spreads remain near cycle lows and breadth has improved, making this something close to a mirror image of early in the second quarter.
Our base case is for volatility to stay elevated, with wide dispersion and continual rotations as the market works through two open questions: whether the AI pullback is the first crack or a healthy mid-cycle reset, and whether the oil-inflation-Fed risk builds or fades.
The setup carries wide tails in both directions, and we are positioned to stay flexible.
Looking further out is harder given the pace at which markets are moving. Yet for all the swings in sentiment this year, major indices remain near record highs, and the consensus still calls for a soft landing, a reflection of the economy's resilience even through a global oil supply disruption.
The bull case is now driven more by corporate earnings than by expectations for lower rates, with AI-related investment the dominant structural force behind earnings growth. Much of that is already viewed as priced in, and expensive valuations paired with unresolved tensions in the Middle East introduce real downside risk.
The next twelve months likely turn on whether earnings can grow into elevated valuations and whether inflation and energy prices stay contained.
Current Market Themes
Federal Reserve Policy: The Fed remains on hold but continues to shift hawkish, with markets now pricing in two rate hikes (September 2026 and early 2027).
Corporate Earnings: A strong second quarter, with the S&P 500 posting its seventh straight quarter of double-digit year-over-year growth and record margins.
Artificial Intelligence: AI capex is powering both economic and EPS growth, though expectations are very high and the industry looks set to stay volatile.
Economic Factors
U.S. GDP Growth: Q2 growth slowed from the first quarter, though core growth (real final sales to private purchasers) held up solidly despite the oil disruption.
Inflation: The oil supply disruption pushed inflation higher, and with oil prices still volatile, there is a risk it stays above target.
Employment: Labor conditions are improving after weakening in late 2025, with the market still relatively tight and "low-fire, low-hire."
U.S. Consumer: Supported by strong equity and labor markets, but facing headwinds from slowing income growth and inflation pressure.
Interest Rates: Rate volatility has come down from recent years, though rates should stay volatile given oil prices and economic uncertainty.
Long Duration Bonds: Neutral to modestly overweight, driven mainly by inflation risk and economic uncertainty; favor Treasuries over corporates.


Why the First Five Years of Retirement Decide the Next Twenty-Five
Most people think the biggest retirement risk shows up late, the fear of running out of money in your eighties or nineties.
However, the conditions that create that risk usually show up much earlier.
The first five years of retirement are a genuine hinge point. Your paycheck stops, withdrawals begin, and decisions about Social Security, taxes, healthcare, investments, and spending all start colliding with one another in ways they never did while you were working.
Those five years don't literally dictate everything that follows. Still, they have an outsized effect on how much flexibility your plan keeps for the twenty that come after.
That's why retirement shouldn't start with a portfolio balance and a withdrawal percentage. Instead, it should start with a plan for the stretch when your financial life is most exposed to change.
Retirement Changes the Math
While you're working, a market decline is uncomfortable, but it's survivable. You're still earning, still contributing, and you have time to let markets recover.
Retirement rewrites that equation.
Once withdrawals begin, your portfolio has to absorb two things at once, the market's swings and the money you're pulling out to live on. As a result, a decline in the first year or two can do far more damage than the same decline fifteen or twenty years later.
That's sequence-of-returns risk.
Two retirees can earn the exact same average return over their retirement and still end up in completely different places, depending on when their best and worst years land. In fact, the decumulation research keeps showing the same thing, that losses early in retirement, paired with ongoing withdrawals, can meaningfully shorten how long a portfolio lasts.
In other words, the average return in your projection doesn't tell the whole story. The order of those returns does.
Why an Early Loss Is So Hard to Recover From
Say you retire with $3 million and plan to draw $150,000 in your first year.
If the portfolio drops 20 percent before you take anything out, it falls to about $2.4 million. After that first $150,000 withdrawal, you're at roughly $2.25 million.
Now the portfolio has to recover from the loss and keep funding every withdrawal that follows.
By contrast, put that same 20 percent decline in year twenty, and the picture changes. By then you may have banked years of positive returns, shortened the horizon the money has to cover, or adjusted your spending. The drop still stings, but the plan is built to take it.
That's why, in our planning work, we don't just ask whether a portfolio can support a given withdrawal over thirty years. We also ask what happens if the bad years show up first.
What if the market falls in year one?
What if inflation stays hot?
What if the roof, the car, and a round of dental work all land in the same twelve months?
What if a large Roth conversion quietly triggers a Medicare premium increase?
A good plan answers those questions before you're forced to answer them in real time, under pressure.
The First Five Years Are About More Than Markets
Sequence risk matters, but markets are only half the story.
The early years of retirement are also when the big, hard-to-reverse decisions get made.
For example, take Social Security. Benefits generally grow for each year you delay claiming past full retirement age, up to age 70. That doesn't make delaying right for everyone, health, marital status, survivor needs, other income, and your withdrawal strategy all weigh in. However, once you claim, your options narrow.
Similarly, consider the window between retiring and the start of required minimum distributions. Your earned income may be lower in those years, which can open room for Roth conversions, capital-gain harvesting, charitable planning, or deliberate withdrawals from tax-deferred accounts. Under current rules, most retirees begin RMDs at age 73, though the exact age depends on your birth year.
Here's where it all ties together, and where a lot of plans go wrong. A Roth conversion can't be judged only by comparing today's tax rate to a future one. Higher income in a single year can raise your Medicare Part B and Part D premiums through IRMAA, pull more of your capital gains into tax, and reshape the tax bill your surviving spouse will one day face. These moves live in the same retirement tax window I've written about before, so I won't rebuild that case here.
The problem isn't that retirees make these decisions. Instead, it's that they too often make them one at a time, when the entire point is to coordinate them.
Two Couples, One Market, Two Outcomes
Picture two couples. Each retires at 65 with $3 million and needs about $150,000 a year to live the life they've planned for. In their first three years, both run into the same rough market.
The first couple keeps taking the full, inflation-adjusted withdrawal straight from the portfolio. They claim Social Security right away, because watching their investments fall makes them nervous. And they go ahead with a big travel year and a major renovation.
No single one of those choices is unreasonable. However, stacked together, in a down market, they pile pressure on a portfolio that's already shrinking.
The second couple runs a different play. They lean on a near-term cash reserve, so they're not selling growth investments into the decline. They separate essential spending from discretionary, and push part of the travel budget out a year. They rebalance back to their policy instead of reacting to the headlines. Finally, they revisit Social Security and Roth conversions in light of the new market and tax picture.
Same returns. Different retirement. The difference wasn't the market, it was the decisions they made around it.
The point isn't that every retiree needs that exact reserve or withdrawal order. Instead, it's that retirement resilience comes from having more than one way to respond.
Flexibility Might Be Your Most Valuable Retirement Asset
In planning conversations, I keep coming back to one distinction, the line between essential spending and flexible spending.
Essential is housing, food, insurance, healthcare, taxes, basic transportation. You can't cut those quickly.
Flexible is travel, gifts, renovations, the vehicle upgrade, the discretionary purchases. Those matter too, retirement is meant to be enjoyed, not endured. However, having some room to shift their timing can keep a temporary market drop from hardening into a permanent setback.
The withdrawal research backs this up. Dynamic strategies that adjust spending when the portfolio moves outside preset guardrails tend to hold up better than mechanically raising withdrawals every year, no matter what markets are doing.
That doesn't mean slashing spending every time the market has a bad month. Instead, it means deciding in advance what would actually trigger a change. For example, ordinary spending might continue through normal volatility, while the big discretionary items get a second look if the portfolio falls past a line you set ahead of time.
The value is in making that call while everyone's calm, not after fear has taken the wheel.
A Five-Year Retirement Stress Test
Before you retire, you want to know the plan can handle more than the expected case. Five tests get you most of the way there.
Test an early market decline
Instead of assuming smooth average returns, model a real drop in year one or two. Then map out exactly how you'd fund spending without abandoning your long-term strategy, whether that's cash, short-term fixed income, trimmed discretionary spending, or another income source. "We'll figure it out when it happens" isn't a strategy.
Separate recurring and irregular spending
A monthly budget is necessary but not sufficient. Roofs, cars, family support, big trips, and uncovered healthcare arrive in lumps, and they belong in the model separately from ordinary lifestyle spending. Otherwise, a plan can look sustainable while quietly ignoring the retirement spending blind spot most likely to derail it.
Build a multiyear tax map
Retirement tax planning shouldn't be done one April at a time. Instead, project your income out through the start of RMDs and beyond, find the years when taxable income dips, and test whether Roth conversions or other moves improve your lifetime tax position, not just this year's return. Then check how each move ripples into IRMAA, capital gains, charitable goals, and your surviving spouse.
Name the permanent decisions
Social Security claiming, pension elections, selling the house, large gifts, certain insurance choices. Some of these can't be undone. Before you act, get clear on what's reversible and what isn't. When uncertainty is high, keeping your options open is often worth more than locking in a permanent answer early.
Set your guardrails
Finally, decide ahead of time how the plan responds when things move. What happens if spending runs 10 percent over plan? If the portfolio drops? If one spouse dies earlier than expected? If a child needs help? If you want a second home? A plan is far more useful when it holds decision rules, not just projections.
The Goal Isn't to Predict the First Five Years
Nobody knows what markets, inflation, tax law, healthcare, or your family will do in your first five years of retirement.
Fortunately, a strong retirement plan never required a crystal ball. It requires preparation.
Those first five years matter because that's when withdrawals begin, the big elections get made, and the portfolio has the least room for an avoidable mistake. However, they don't have to dictate the rest of your retirement. A coordinated plan gives you room to respond, through appropriate reserves, flexibility in your discretionary spending, coordinated tax decisions, a disciplined portfolio, and a plan you actually revisit as life changes.
So before you circle a retirement date, don't ask only whether you've saved enough. Ask whether the plan can survive an unfavorable start.
Because the strength of a retirement plan isn't how well it works when everything goes right. It's how much flexibility you've still got when something goes wrong. That's where clarity, confidence, and peace of mind actually come from.
If you'd like to pressure-test your own first five years, especially how your withdrawals, Social Security timing, and Roth conversions interact before the difficult years get a vote, that's the conversation we have every day. We'd be glad to have it with you.
Sources
Social Security Administration. "Delayed Retirement Credits."
https://www.ssa.gov/benefits/retirement/planner/delayret.html
Internal Revenue Service. "Retirement Plan and IRA Required Minimum Distributions FAQs."
https://www.irs.gov/retirement-plans/retirement-plan-and-ira-required-minimum-distributions-faqs
Social Security Administration. "Medicare Premiums: Rules for Higher-Income Beneficiaries" (income-related monthly adjustment amounts for Part B and Part D).
https://www.ssa.gov/benefits/medicare/medicare-premiums.html
Jonathan Guyton and William Klinger. "Decision Rules and Maximum Initial Withdrawal Rates." Journal of Financial Planning, March 2006.
https://www.financialplanningassociation.org/article/journal/MAR06-decision-rules-and-maximum-initial-withdrawal-rates
Morningstar. "The State of Retirement Income."
https://www.morningstar.com/retirement/morningstars-retirement-income-research-finding-your-safe-withdrawal-rate

Weekly Market Update: Oil Shock Pushes Yields to Fresh Highs
Markets traded lower this week as the conflict in the Middle East intensified and oil prices surged 17%.
The S&P 500 and Nasdaq each declined roughly 2%, while the Russell 2000 finished the week down about 1.5%. Most equity factors also moved lower, including Growth, Value, and Equal Weight, as market participation weakened.
Momentum and High Beta were the two exceptions. Both outperformed after lagging in recent weeks, helped in part by continued weakness across semiconductor stocks.
At the sector level, Energy and Utilities led the market higher. Meanwhile, Consumer Discretionary declined nearly 7% as investors considered how higher fuel and transportation costs could affect household spending and corporate profit margins.
Bonds also traded lower as interest rates rose across the yield curve. Longer-maturity bonds underperformed, which is typically what we’d expect when investors become more concerned about inflation. The VIX climbed back toward 20 late in the week, while the U.S. dollar strengthened as interest rates rose and market volatility increased.
Key Takeaways
Oil Prices Rise as the U.S.-Iran Conflict Escalates
The United States carried out a twelfth consecutive night of strikes this week, while Iran continued targeting tankers traveling through the Strait of Hormuz. The strait is one of the world’s most important energy corridors and carries a significant share of the global oil trade.
Meanwhile, Yemen’s Houthi rebels added another layer of uncertainty by threatening a naval blockade against Saudi Arabia. That threat raises the possibility of disruption not only in the Strait of Hormuz, but also across shipping routes in the Red Sea.
Oil prices responded quickly. West Texas Intermediate crude climbed above $90 per barrel, while Brent crude, the international benchmark, briefly touched $100. Both reached their highest levels in roughly six weeks.
At the same time, there’s been little visible diplomatic progress. Secretary of State Marco Rubio said Iran was “not serious about talks,” reducing near-term expectations for a negotiated resolution.
Why It Matters: The conflict had shown signs of stabilizing, but each additional strike, tanker attack, or threat to shipping routes introduces a new risk premium into oil prices.
The issue isn’t simply whether oil reaches a particular price. What matters is how long prices remain elevated and whether those higher costs begin working their way through transportation, manufacturing, utilities, and consumer spending.
In other words, the longer the conflict continues, the greater the chance that an overseas geopolitical event turns into a broader inflation and economic-growth concern for the United States.
Rising Oil Prices Push Treasury Yields to Fresh 52-Week Highs and Revive Expectations for a Fed Rate Hike
This week’s move in Treasury yields was a direct extension of the Middle East story.
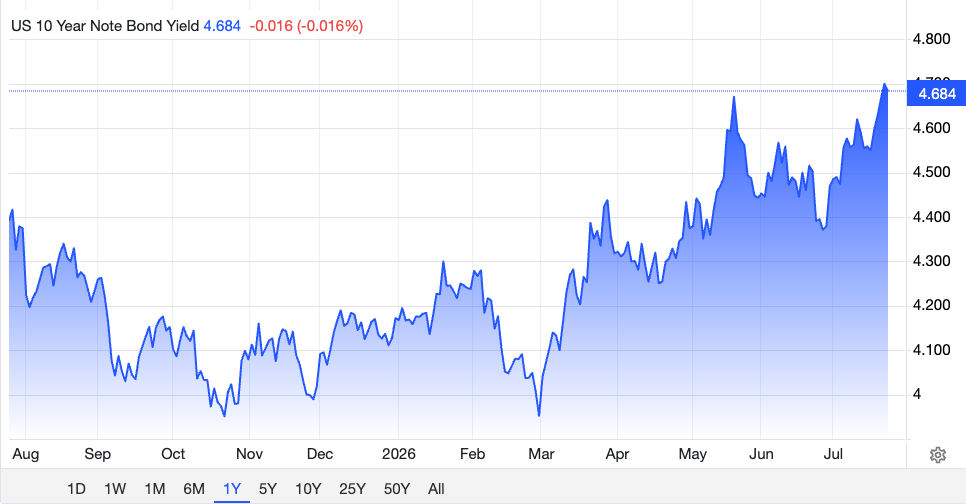
The 10-year Treasury yield rose above 4.70%, reaching a new 52-week high, as investors began pricing a greater risk that higher energy costs could keep inflation elevated.
Expectations for Federal Reserve policy also shifted. Fed funds futures now assign a greater than 80% probability to an interest-rate increase at the Fed’s September meeting, up from approximately 50% one week ago.
That’s a meaningful change in a short period of time. It suggests that investors are no longer viewing the rise in oil prices as an isolated market event. Instead, they’re considering whether higher energy costs could affect the Fed’s broader inflation outlook.
Why It Matters: Treasury yields are now closely tracking developments in the Middle East, which highlights how interconnected energy markets, inflation expectations, and interest rates have become.
Higher yields can create pressure across several parts of the economy. They can raise borrowing costs for households and businesses, weigh on bond prices, and make it more difficult for highly valued stocks to justify their current prices.
However, the key question for the Fed is whether the rise in energy prices is temporary or whether it begins affecting wages, consumer expectations, and the prices of other goods and services.
A short-lived oil shock may not change the Fed’s plans. A prolonged inflationary shock could.
Alphabet’s Strong Quarter Was Overshadowed by a Growing AI Capital-Spending Commitment
Alphabet reported second-quarter results Wednesday that exceeded expectations across several major areas.
Revenue increased 24% to $120 billion, Google Cloud revenue jumped 82%, and operating margins expanded. By most traditional measures, it was a strong quarter.
However, Alphabet shares still declined approximately 5% in after-hours trading as investors focused on the amount of spending required to produce that growth.
The company increased its 2026 capital-expenditure guidance to between $195 billion and $205 billion, up from its previous range of $180 billion to $190 billion. Management also indicated that spending would increase again in 2027.
Meanwhile, quarterly free cash flow turned negative for the first time in the company’s history as capital spending exceeded the cash generated by its operating businesses.
Why It Matters: The market doesn’t appear to be questioning whether artificial intelligence is contributing to growth. Alphabet’s results provide strong evidence that it is.
Instead, investors are asking a more difficult question: How much will companies have to spend to generate that growth, and when will those investments begin producing an attractive return?
That distinction matters because revenue growth alone doesn’t necessarily create shareholder value. Companies also need to demonstrate that the cash invested in data centers, chips, energy, and other AI infrastructure can eventually produce sustainable profits and free cash flow.
For now, the market appears willing to support substantial AI investment. However, investors are becoming less willing to accept an unlimited spending commitment without clearer evidence of the eventual payoff.
Next Week’s Calendar Could Answer Many of These Questions
Several of the market’s biggest current debates will be tested within a two-day period next week.
The Federal Reserve’s two-day meeting concludes Wednesday, July 29, with an interest-rate decision and press conference. Investors will be listening closely for signs that officials view higher energy prices as a temporary disruption or as a reason to reconsider the path of monetary policy.
Microsoft and Meta will report earnings after the market closes that same day. Their results will provide two more important data points in the debate over AI-related spending, revenue growth, and investment returns.
Then, on Thursday, investors will receive the advance estimate of second-quarter gross domestic product and the June Personal Consumption Expenditures Index, the Fed’s preferred inflation gauge.
Apple and Amazon will report earnings after Thursday’s closing bell, adding additional information about consumer demand, cloud computing, and corporate technology spending.
Why It Matters: Nearly every major question discussed this week will face a real-world test next week.
The inflation data may show whether price pressures were already building before the latest rise in oil. The Fed’s comments may clarify whether officials are prepared to respond to energy-driven inflation. Meanwhile, the technology earnings reports may reveal whether AI spending is continuing to generate enough growth to justify its rapidly rising cost.
Any one of these events could move markets. Taken together, they could determine whether this week’s volatility was a temporary response to geopolitical uncertainty or the beginning of a more meaningful shift in the market’s outlook for inflation, interest rates, and corporate profits.

The Tax Bill You're Leaving Your Kids
One of the most common things I hear in a Roth conversion conversation is, "I don't want to pay the tax until I have to."
That sounds conservative. Why create a tax bill today when you could leave the money invested?
But for families with more retirement money than they're likely to spend, delaying the tax doesn't avoid it. It moves it. Off the parents' return, onto the children's.
Your kids may inherit that account in their forties or fifties, in the highest-earning years of their careers. So the dollars you declined to convert at a 22 percent marginal rate could come out later while they're paying 32 percent or more.
The family pays the tax either way.
The only real question is whether you decide whose return the income lands on, or whether you let that get decided for you.
A Traditional IRA Is More Than an Investment Account
A traditional IRA isn't just an investment account. It's an investment account with a deferred tax liability attached.
The balance on the statement isn't the amount your family gets to spend.
If the account holds mostly deductible contributions and tax-deferred growth, distributions are generally taxable income. During your lifetime, required minimum distributions eventually force some of that income onto your return. If you die with money still in the account, your beneficiaries inherit the assets and the tax obligation that rides along with them.[1]
There are exceptions worth knowing. Part of an IRA may represent after-tax basis. A qualifying charity can generally receive the account without paying the income tax an individual beneficiary would owe. A surviving spouse has options an adult child doesn't.[1]
But when a parent leaves a largely pretax IRA to adult children, the tax liability doesn't disappear.
It changes taxpayers.
The SECURE Act Compressed the Window
Before the SECURE Act, many non-spouse beneficiaries could stretch inherited IRA distributions over their life expectancy. Depending on the beneficiary's age, that could spread the taxable income across decades.
For most adult children today, that's gone.
Most adult children are designated beneficiaries, but not "eligible designated beneficiaries." They generally have to empty the inherited IRA by December 31 of the year containing the tenth anniversary of the owner's death.[1][3]
The main exceptions are a surviving spouse, the owner's minor child, a disabled or chronically ill beneficiary, and someone who isn't more than ten years younger than the account owner.[1]
What happens inside those ten years depends on when the owner died.
If the owner died before the required beginning date for minimum distributions, the beneficiary generally doesn't have to take annual distributions in years one through nine. The account still has to be empty by the end of year ten.[1][3]
If the owner died on or after the required beginning date, the beneficiary generally has to keep taking annual required distributions during the ten-year period, and still empty the account by the end of year ten.[1][3]
Either way, the window is a lot shorter than most families expect.
Your Children May Inherit the IRA at the Worst Possible Time
The problem with the ten-year rule isn't that ten years is short.
It's which ten years they turn out to be.
Your children might inherit this account while they're earning peak salaries, taking bonuses, exercising options, selling company stock, running a business, or writing tuition checks for your grandchildren.
Then, on top of all of that, they have to empty an inherited IRA.
Those distributions can push part of the account into a higher federal bracket. They can also reach state income taxes, deductions, credits, and capital-gain rates.
That's why I don't evaluate a conversion by asking only, "How much tax would you pay this year?"
I ask a different question. Which family member is most likely to report these dollars as income, in which years, and at what incremental rate?
That turns a one-year tax calculation into a multigenerational planning decision.
Consider a 74-Year-Old Widow With a $1.4 Million IRA
Say a 74-year-old widow has $1.4 million in a traditional IRA.
She's already taking required minimum distributions. After her other income and deductions, additional taxable income still falls in the 22 percent federal bracket.
She passes on Roth conversions. Her tax bill already feels high enough, and paying more on purpose doesn't seem necessary.
Now say she dies several years later and leaves the remaining IRA equally to her two adult children.
Both are in their late forties. Both are already earning well. Once the inherited distributions stack on top of their existing income, assume those incremental dollars land in the 32 percent bracket.
For illustration, each child inherits $700,000 and takes $70,000 a year over ten years. Before any growth, the family recognizes $1.4 million of inherited IRA income during that period.
At an assumed 32 percent marginal rate, that's roughly $448,000 of federal income tax.
Apply an assumed 22 percent rate to the same $1.4 million and you get roughly $308,000.
A simplified difference of $140,000.
The family pays the tax either way. It just paid ten points more, and nobody chose it.
One qualification matters here. This doesn't mean the widow could have converted the whole $1.4 million at 22 percent. A conversion that size would cross several brackets. Federal brackets also apply in layers, so not every dollar a beneficiary withdraws is taxed at their top rate. The illustration compares two incremental rates on the same dollars. It isn't a forecast.
The real opportunity would have been a series of partial conversions over several years. Some might happen after retirement but before required distributions begin. Others could happen after RMDs start, as long as the required distribution comes out first, because an RMD itself can't be converted to a Roth IRA.[4]
So the credible question was never whether she could convert everything at 22 percent.
It's how much of the account she could move over time at a lower family tax rate than her children may eventually pay.
What I'd Actually Model
A useful conversion analysis has to do more than compare today's bracket against a child's assumed future bracket.
In our planning process, I want to see at least five scenarios.
- The parent's tax bill with no conversions.
We need a baseline first. That means projecting IRA growth, required distributions, Social Security, pensions, deductions, filing status, and other taxable income.
Without it, we don't know whether the IRA is likely to shrink, hold steady, or keep growing even while distributions come out. In a lot of cases it keeps growing, and that surprises people.
- A series of partial conversions.
Then we model several amounts instead of an all-or-nothing decision. We might compare converting enough to stay inside a target bracket against pushing into the next rate on purpose.
The goal isn't to minimize this year's tax bill. It's to find out whether paying more now lowers the family's projected lifetime tax cost.
This is also where we settle how the conversion tax gets paid. Outside assets or withholding from the IRA. Paying from the IRA leaves fewer dollars inside the Roth and can shrink the benefit you're converting to capture.
- The surviving spouse.
For married couples, the children usually aren't the first tax problem. The first problem shows up when one spouse dies.
The survivor may keep most of the same income and file as a single taxpayer, which means reaching higher brackets on less income.
Conversions can protect the spouse who lives longer, not just the next generation.
- The beneficiaries' likely tax range.
Nobody knows what your children will earn twenty years from now. No projection fixes that.
We can still make reasonable estimates. Are they early in high-income careers? Do they own businesses? Might they retire before they inherit? Does one live in a high-tax state while the other lives somewhere with no income tax?
We aren't trying to predict their returns. We're trying to see whether there's a meaningful chance they pay a higher incremental rate than you could pay today.
- Where the IRA is actually headed.
Finally, who's getting this account?
If it's going to charity, a conversion is usually less attractive, since a qualifying charity can generally receive traditional IRA assets without the income tax an individual beneficiary would owe. Someone already making qualified charitable distributions may be shrinking the IRA and meeting charitable goals at the same time.
If it's headed to high-earning children, the beneficiary tax cost deserves more weight.
A Roth IRA Changes the Character of the Inheritance
Converting doesn't get your children out of the ten-year rule. They'll still generally need to empty an inherited Roth by the end of the tenth year.[1]
Two things change, though.
Qualified Roth distributions can generally come out free of federal income tax.[5] A child can take a large withdrawal without adding the same amount to taxable income, so it doesn't push wages, bonuses, business income, or capital gains into higher brackets.
And because a Roth owner is never treated as dying after a required beginning date, an inherited Roth generally doesn't carry the annual distribution requirement that an inherited traditional IRA can.[1] That's the mechanism behind the flexibility. Your child can leave the account invested and take it near the end of the ten years, on their own timing.
The five-year rule still matters. Death is itself a qualifying event, so for a beneficiary the holding period is the remaining hurdle. If the applicable five-tax-year period has been satisfied, distributions after the owner's death are generally qualified. If it hasn't, earnings distributed from the inherited Roth can still be taxable until that period is complete.[1][5]
Which is one more reason this planning works better when it starts years before the account is expected to change hands.
When a Conversion Isn't the Answer
A credible analysis has to say when the answer is no.
Conversions get less compelling when your children are likely to be in lower brackets than you are, or when most of the IRA is headed to charity. They get less compelling when the tax would trigger a Medicare premium increase you aren't willing to absorb, when you're planning to move from a high-tax state to a low-tax one, or when paying the bill would cut into liquidity you actually need. If you'd have to use a large slice of the IRA itself to cover the tax, that's a warning sign too. Substantial after-tax basis inside the account changes the math. So does having other deductions or charitable strategies that could reduce future IRA income more efficiently.
Tax rates change. So do account values, spending needs, beneficiaries, and estate plans.
So a conversion projection isn't a one-time answer. It's a document you update as the family changes.
The Decision Is Bigger Than This Year's Bracket
The traditional IRA you decide not to convert doesn't escape taxation.
For most families leaving pretax retirement assets to individual heirs, the decision just determines who pays it later.
That could be you, through required distributions.
It could be a surviving spouse, filing single.
Or it could be your children, emptying the account during the highest-earning years of their lives.
So the question isn't whether you're comfortable paying 22 percent today.
The question is whether 22 percent is the lowest rate your family will ever see.
The IRA gets taxed eventually. What's still up to you is whose return it lands on, what rate applies, and whether anybody chose it on purpose.
Build the projection while you still have the choice.
Then decide on purpose. That's what clarity, confidence, and peace of mind look like on a tax return.
Sources
- Internal Revenue Service, Publication 590-B, "Distributions from Individual Retirement Arrangements (IRAs)," including beneficiary categories, the ten-year rule, and inherited Roth IRA distribution rules. https://www.irs.gov/publications/p590b
- Internal Revenue Service, "Retirement Topics: Beneficiary." https://www.irs.gov/retirement-plans/plan-participant-employee/retirement-topics-beneficiary
- U.S. Department of the Treasury and Internal Revenue Service, "Required Minimum Distributions," final regulations, July 19, 2024. https://www.govinfo.gov/content/pkg/FR-2024-07-19/pdf/2024-14542.pdf
- Internal Revenue Service, Publication 590-A, "Contributions to Individual Retirement Arrangements (IRAs)," including the taxation of conversions and the rule that a required minimum distribution can't be converted. https://www.irs.gov/publications/p590a
- Internal Revenue Service, "Roth IRAs," including qualified distributions and the five-year holding period. https://www.irs.gov/retirement-plans/roth-iras

Weekly Market Update: Tech Stumbles, but the Broader Market Holds Steady
Markets finished the week mixed as leadership continued to rotate beneath the surface.
The S&P 500 slipped -0.1%, while the Nasdaq declined -2.5% as investors moved away from Technology stocks. However, the weakness in the major indexes didn’t tell the full story.
Both value stocks and the equal-weighted S&P 500 outperformed, which suggests that the average stock held up better than the largest companies driving the headline indexes. Meanwhile, high-beta and momentum stocks led the market lower because of their heavy exposure to Technology, which declined -4.3% for the week.
Even so, eight of the eleven S&P 500 sectors finished higher, led by Energy and Consumer Staples. That broader participation helped offset some of the weakness in Technology.
Bonds were mostly unchanged. However, longer-dated Treasury bonds modestly underperformed as oil prices surged nearly +10% following renewed conflict in the Middle East.
Elsewhere, the VIX, a measure of expected market volatility, held steady. The U.S. dollar was little changed, while Bitcoin gained +1.0%.
Key Takeaways
Inflation Cooled Sharply in June as Energy Prices Fell
Consumer inflation declined sharply in June.
The Consumer Price Index, or CPI, fell -0.4% for the month, marking its largest monthly decline in more than six years. As a result, the annual inflation rate slowed to +3.5% from +4.2% in May.
Wholesale inflation eased as well, suggesting that some price pressures were moderating before reaching consumers.
However, much of the improvement came from energy. Gasoline prices declined nearly -10%, which pulled down both consumer prices and wholesale costs.
That distinction matters because June’s report reflects a period when oil prices were falling and were significantly lower than they are today. Since the beginning of July, the U.S.-Iran ceasefire has broken down, and crude oil has climbed back toward $80 per barrel after starting the month below $70.
Why it matters: June’s inflation improvement was real, but it depended heavily on lower energy prices that have already begun to reverse. With inflation still above the Federal Reserve’s 2% target and oil prices climbing again, the central bank has signaled that it may need to raise interest rates.
Wall Street Banks Reported Strong Second-Quarter Earnings
Wall Street banks benefited from a busy and volatile second quarter.
Banks earn fees when companies issue debt or stock, complete mergers, go public, or increase their trading activity. During the second quarter, all of those areas were active.
A wave of dealmaking and initial public offerings, including the roughly $75 billion SpaceX debut, helped drive investment banking revenue higher. At the same time, market volatility tied to the Middle East conflict and the continued AI boom supported trading revenue.
AI-related financing added another source of activity. Companies continued raising debt and equity to fund the construction of data centers and other infrastructure needed to support AI development.
As a result, Goldman Sachs reported the strongest quarter in its history. JPMorgan Chase, the nation’s largest bank, increased earnings by more than +40% compared with the same period a year ago.
Why it matters: The same active and volatile market environment that created uncertainty for investors worked in the banks’ favor. When companies raise capital and investors trade more frequently, banking fees and trading revenue tend to rise.
The Broader Market Held Steady as Technology Turned Volatile
Semiconductor stocks continued to experience sharp day-to-day swings as investors questioned the pace, cost, and potential payoff of the AI buildout.
However, that volatility hasn’t spread across the broader market.
Instead, market leadership has rotated. As investors reduced exposure to chipmakers and other Technology stocks, they moved into areas such as Financials, Industrials, Energy, and Consumer Staples.
Because of that rotation, the S&P 500 remains within 1% of its early June record despite the recent weakness in Technology.
There are also few signs of broader financial stress. The VIX remains in the mid-teens, while credit markets have stayed calm and credit spreads remain extremely tight.
Why it matters: This year’s most popular trade has become more volatile, but the weakness hasn’t pulled the entire market lower. Other sectors have begun to participate, helping offset the decline in semiconductor and Technology stocks.
Consumer Spending Continued to Rise in June
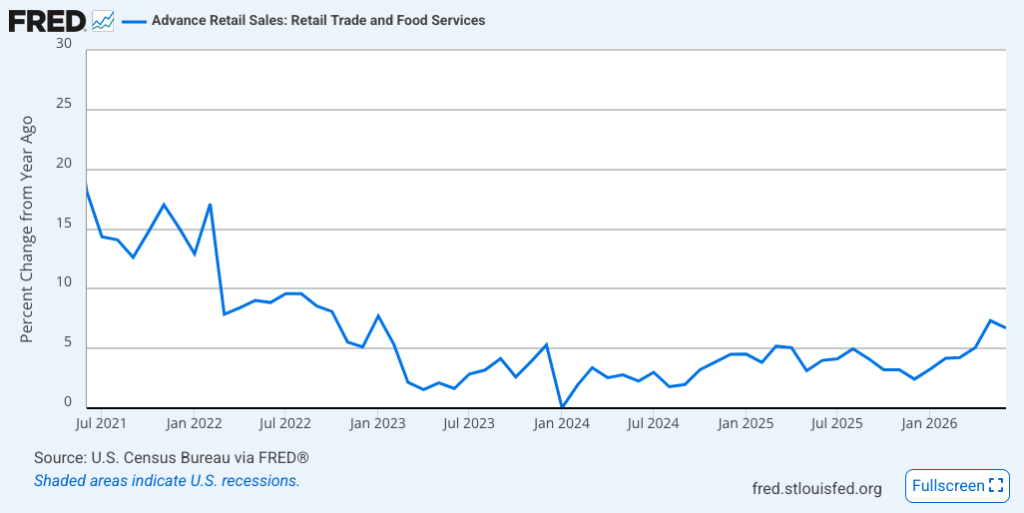
Retail sales increased +0.2% in June. That was slower than May’s revised +1.0% gain, but it was in line with expectations.
Once again, energy prices played an important role.
Lower gasoline prices reduced sales at gas stations, which weighed on the headline retail sales figure. However, those same lower energy costs also helped ease inflation and left consumers with more money to spend elsewhere.
Excluding gasoline, retail sales increased +0.7%. Online shopping contributed to the gain as consumers took advantage of promotions surrounding Amazon’s Prime Day.
Why it matters: Consumer spending drives most of the U.S. economy. June’s report suggests that spending is continuing to hold up rather than stall, particularly once the effect of lower gasoline prices is removed.

Retirement: 8 Tests Before You Leave Your Paycheck Behind
Retirement shouldn’t begin with a guess.
Still, that’s effectively what happens when someone chooses a retirement date based primarily on the balance of an investment account.
The number may look substantial. The financial projection may show a high probability of success. And after decades of working and saving, it may finally feel like the right time to leave.
However, retirement readiness isn’t determined by one number.
Instead, it depends on whether the major pieces of your financial life can continue working together after your paycheck stops.
In our planning work, we don’t begin the retirement conversation by asking whether someone has reached a particular portfolio balance. We begin by looking at what the paycheck currently supports, what will replace it, and which financial decisions could put the most pressure on the plan after retirement.
That process usually requires more than an investment projection.
It requires a retirement readiness test.
Why Your Retirement Number Isn’t Enough
Most people begin with a straightforward question:
Do I have enough money to retire?
That’s an important question. However, it’s also incomplete.
Two couples could each have $4 million saved and have very different levels of retirement readiness.
One couple may have no debt, predictable spending, substantial taxable savings, two pensions, and both spouses already enrolled in Medicare.
Meanwhile, the other couple may have a large mortgage, most of its wealth in tax-deferred retirement accounts, several years to go before Medicare, and ongoing financial responsibilities for parents or adult children.
The account balances may be identical.
Nevertheless, the retirement decisions aren’t.
That’s because a portfolio can tell you how much you’ve accumulated, but it can’t tell you whether your spending is realistic, whether your tax strategy is coordinated, or whether your family is prepared for an unexpected health or caregiving event.
So, before choosing a retirement date, we believe the plan should pass eight readiness tests.
Test 1: Do You Know What Retirement Will Actually Cost?
First, you need a dependable estimate of what you’ll spend.
That sounds simple. Yet, in practice, it’s often one of the least developed parts of a retirement plan.
Many households know approximately what comes out of their checking account each month. However, that number may not include irregular expenses such as travel, home repairs, vehicle replacements, financial support for family members, or large insurance premiums.
Additionally, retirement spending rarely remains constant.
During the early years, you may spend more on travel, hobbies, dining, or home projects. Later, those expenses may decline while healthcare, home assistance, or caregiving costs increase.
As a result, one static spending assumption may not adequately describe a retirement that could last 25 or 30 years.
When we review retirement spending, we separate expenses into three broad categories:
- Core expenses are the costs required to maintain your household, including housing, utilities, food, insurance, and basic healthcare.
- Lifestyle expenses include travel, entertainment, gifts, hobbies, and other discretionary spending.
- Contingent expenses are costs that may not occur every year but still need to be planned for, such as major home repairs, helping an aging parent, or replacing a vehicle.
This distinction matters because each category has a different level of flexibility.
If markets decline, you may be comfortable postponing a large trip. However, you probably won’t be able to postpone property taxes, health insurance premiums, or a new roof.
Therefore, the first readiness test isn’t whether your portfolio can support one spending number.
It’s whether you understand which expenses are essential, which are flexible, and which could surprise you.
Test 2: Do You Know What Will Replace Your Paycheck?
Once spending is clear, the next step is mapping out your retirement income.
That may include Social Security, pensions, investment income, retirement account withdrawals, rental income, deferred compensation, or part-time work.
However, income planning isn’t simply a matter of adding those sources together.
Timing matters.
For example, you may retire several years before claiming Social Security. A pension may not begin immediately. Deferred compensation may arrive in large installments rather than predictable monthly payments.
Consequently, the first several years of retirement may place more pressure on your portfolio than the later years.
The plan should also consider what happens after the first spouse dies.
A married couple receiving two Social Security payments may eventually become a surviving household receiving one benefit. A surviving spouse may qualify for the higher applicable benefit, but the two payments generally aren’t added together.
Meanwhile, many household expenses may remain largely unchanged.
The surviving spouse may still have the same house, property taxes, insurance premiums, and maintenance costs. However, the household may now have less income and narrower federal tax brackets.
Therefore, a retirement income plan shouldn’t work only while both spouses are alive.
It should also be tested for the survivor.
Test 3: Do You Have Enough Liquidity?
Next, you need to determine how much money should remain readily available.
Retirement changes the role of cash.
While you’re working, a paycheck can replenish your checking account after a large expense. Once you retire, that expense may need to be funded by selling investments or withdrawing money from a retirement account.
That can become a problem during a market decline.
If you’re forced to sell investments after they’ve fallen, you’re not only realizing the loss. You’re also removing assets that would otherwise have the opportunity to participate in a recovery.
That’s why we don’t view a retirement cash reserve as idle money.
Instead, it’s a source of financial flexibility.
The appropriate amount will vary by household. However, it should generally reflect near-term spending needs, known major purchases, the reliability of outside income, and the level of risk in the investment portfolio.
At the same time, holding too much cash can create another problem. Over long periods, inflation can reduce its purchasing power.
So, the goal isn’t to move everything out of the market before retirement.
Rather, the goal is to maintain enough liquidity that you won’t need to make a rushed investment decision simply because a bill is due.
Test 4: Have You Built a Retirement Tax Strategy?
Taxes don’t disappear when your paycheck stops.
In many cases, they become more complicated.
During your working years, income may come primarily from wages. In retirement, however, cash flow may come from several sources with different tax characteristics.
Traditional retirement account withdrawals are generally taxable. Qualified Roth withdrawals may be tax-free. Brokerage account sales may create capital gains. Social Security may become taxable depending on the household’s other income.
Meanwhile, higher income can also increase Medicare Part B and Part D premiums through income-related monthly adjustment amounts.
Therefore, the question isn’t simply which account has money available.
The better question is which account should fund spending this year without creating unnecessary problems in future years.
For instance, the period after retirement but before required minimum distributions begin may create an opportunity to recognize income intentionally through Roth conversions.
However, that doesn’t mean converting as much as possible.
A Roth conversion can affect federal and state taxes, Medicare premiums, capital-gain taxation, healthcare subsidies before Medicare, and the amount of cash available for spending.
Additionally, required minimum distributions generally apply to traditional IRAs and many employer retirement plans under current tax rules.
As a result, the tax strategy should look beyond this year’s tax return.
It should consider the full retirement timeline.
The objective isn’t necessarily to pay the least amount of tax in one particular year. Instead, it’s to manage lifetime taxes while preserving the flexibility to fund the life you want.
Test 5: Have You Planned for Healthcare?
Healthcare is one of the biggest variables in the retirement decision.
If you retire before age 65, you’ll need to determine how you’ll maintain coverage until Medicare begins.
Depending on your circumstances, that may involve coverage through a spouse, COBRA, an Affordable Care Act marketplace plan, or private insurance.
However, the premium is only part of the cost.
You’ll also need to consider deductibles, copays, prescription expenses, dental care, vision care, and out-of-pocket limits.
Then, once Medicare begins, the planning doesn’t stop.
Original Medicare doesn’t cover every healthcare expense. For example, it generally doesn’t cover most routine dental care, hearing aids, or long-term custodial care.
That distinction is important.
Medicare may cover qualifying short-term skilled nursing care under certain conditions. However, it generally doesn’t cover ongoing custodial care when help with activities such as bathing, dressing, or eating is the only care required.
Therefore, a complete healthcare review should address two different risks:
The first is how you’ll pay for medical coverage and routine healthcare expenses.
The second is how you’d fund an extended-care need that Medicare may not cover.
Without both pieces, an otherwise strong retirement plan may still contain a significant blind spot.
Test 6: Do Your Debt and Housing Decisions Support the Plan?
Next, consider the role of debt.
A mortgage payment that felt manageable during your working years may feel different when it’s funded through portfolio withdrawals.
At the same time, paying off the mortgage immediately before retirement isn’t automatically the right answer.
For example, withdrawing a large amount from a traditional IRA could create a sizable tax bill. Using taxable savings to eliminate the mortgage could reduce the liquidity available for healthcare, home repairs, or a market downturn.
Therefore, the question isn’t simply whether you can pay off the house.
It’s whether paying it off improves the overall plan.
Housing also needs to be evaluated beyond the mortgage.
Consider whether the home will remain:
- Affordable to maintain
- Physically accessible
- Close to family and healthcare
- Appropriate for the lifestyle you want
- Practical if one spouse is living there alone
A retirement projection may assume that you’ll stay in the same home indefinitely. However, that assumption should be tested rather than accepted automatically.
Ultimately, the home should support your retirement.
Your retirement shouldn’t exist primarily to support the home.
Test 7: Are Your Protection and Estate Plans Current?
As retirement approaches, insurance needs often change.
Disability insurance may become less important once earned income stops. Meanwhile, long-term care, property, liability, and umbrella coverage may become more important.
Life insurance also deserves a fresh review.
Some policies may no longer be necessary because the original income-replacement need has declined. However, other policies may still play a role in supporting a surviving spouse, providing liquidity, funding a legacy goal, or covering an estate-planning need.
The objective isn’t to cancel every policy once you retire.
Instead, it’s to determine whether each policy still has a specific job.
The same principle applies to your estate plan.
Wills, trusts, financial powers of attorney, healthcare directives, and beneficiary designations should reflect your current wishes and family circumstances.
However, estate planning isn’t only about transferring assets after death.
It’s also about preparing for incapacity.
Your family should know who can make financial and medical decisions, where important documents are located, and how essential accounts and bills will be managed during an emergency.
Otherwise, a financially sound retirement plan may become difficult to implement precisely when your family needs it most.
Test 8: Are You Personally Ready to Retire?
Finally, retirement readiness isn’t purely financial.
Work provides more than income.
It may also provide structure, identity, relationships, intellectual stimulation, and a sense of purpose.
Once work ends, those things don’t automatically replace themselves.
That’s why we ask clients to think beyond the retirement date.
What will an ordinary Tuesday look like?
How will you spend your time after the initial travel and home projects are complete?
How will you maintain friendships and social connections?
What will give you a sense of progress or contribution?
And if you’re married, have you and your spouse discussed what each of you expects retirement to look like?
A person can be financially prepared to retire and still struggle with the transition.
Conversely, someone may feel emotionally ready to leave but discover that the financial pieces haven’t yet been coordinated.
A durable retirement plan needs both.
What a $4 Million Portfolio Doesn’t Tell You
Consider a hypothetical married couple with $4 million in total savings and investments.
At first glance, they appear ready to retire.
However, the account balance doesn’t reveal the full picture.
Of the $4 million, assume $2.8 million is held in traditional tax-deferred retirement accounts. Another $700,000 is held in a taxable brokerage account, $300,000 is in Roth accounts, and $200,000 is in cash.
The couple estimates that they spend approximately $160,000 per year. However, that estimate doesn’t fully include irregular home repairs, vehicle replacements, or travel.
They also have a mortgage costing approximately $4,000 per month.
Additionally, one spouse is several years away from Medicare eligibility. The couple expects to provide roughly $18,000 per year of support to an aging parent, and their estate documents haven’t been updated in more than 10 years.
Neither spouse has started Social Security.
So, are they ready?
Possibly.
However, the $4 million balance alone can’t answer the question.
Before choosing a retirement date, the couple would need to determine:
- Whether $160,000 accurately reflects their full spending
- How much additional money is needed for health insurance
- Whether the mortgage should be maintained, refinanced, or paid off
- How family support affects sustainable withdrawals
- Which accounts should fund the first several years
- Whether partial Roth conversions improve the long-term tax picture
- How the plan changes when Social Security begins
- Whether the surviving spouse can maintain the household
- How much cash should remain outside the investment portfolio
- Whether estate and incapacity documents need to be updated
The couple may discover that they can retire as planned.
Alternatively, they may decide to work one more year, reduce a planned expense, restructure the mortgage, or create a more deliberate withdrawal strategy.
The purpose of the analysis isn’t to push retirement further away.
Instead, it’s to replace uncertainty with informed tradeoffs.
Test the Full Plan Before Choosing the Date
Before submitting your retirement notice, step back and review the entire financial system that will need to replace your paycheck.
Do you understand what retirement will cost?
Do you know where your income will come from?
Do you have enough liquidity to avoid selling investments at the wrong time?
Have you coordinated taxes, healthcare, housing, insurance, and estate planning?
Have you tested what happens if markets fall, inflation remains elevated, a spouse dies, or a family member needs help?
And just as importantly, do you know what you’re retiring to?
The goal isn’t to eliminate every uncertainty.
That’s impossible.
Instead, the goal is to identify the decisions that matter most, understand the tradeoffs, and make sure the major pieces of your financial life can continue working together.
Because retirement readiness isn’t determined by whether you’ve reached one particular number.
It’s determined by whether the full plan is ready to support the life that comes next.
Sources
- Internal Revenue Service, required minimum distribution guidance. https://www.irs.gov/retirement-plans/plan-participant-employee/retirement-topics-required-minimum-distributions-rmds
- Social Security Administration, retirement and survivor-benefit guidance. https://www.ssa.gov/survivor/amount
- Centers for Medicare & Medicaid Services, Medicare premiums and income-related adjustments. https://www.cms.gov/newsroom/fact-sheets/2026-medicare-parts-b-premiums-deductibles
- Medicare.gov, services not covered by Original Medicare and long-term-care guidance. https://www.medicare.gov/coverage/long-term-care

The Retirement Tax Window Most People Miss
Some people think retirement tax planning begins when required minimum distributions show up.
That is understandable.
For decades, the retirement tax conversation has been framed around age-based triggers. Social Security. Medicare. Pension elections. Required minimum distributions. Roth conversions. Charitable distributions. Estate planning.
And because many of those decisions become more visible later in retirement, it is easy to assume the real planning does not begin until then.
But that is often too late.
For many retirees, one of the most valuable tax-planning windows opens in the years just before and just after retirement. It is the period after earned income declines, but before every major retirement income source has fully started.
I think of this as the retirement tax gap.
It is the gap between your working-income years and your forced-income years.
And if you miss it, you may not get the same opportunity again.
Why This Window Matters
During your working years, your tax picture is often driven by your paycheck.
You may have salary, bonus income, business income, equity compensation, deferred compensation, or other income tied to work. Even if you are saving aggressively, your flexibility can be limited because your taxable income is already high.
Then retirement begins.
For some households, income drops quickly. The paycheck stops. Bonus income disappears. Equity compensation may slow or end. Business income may decline. And for a few years, the tax return may look very different from the one you had while working.
But that lower-income period may not last forever.
Social Security may begin later. Pension income may start. Medicare premiums may be affected by income. Required minimum distributions eventually force money out of tax-deferred retirement accounts. Under current IRS rules, retirement account owners generally must begin RMDs starting with the year they reach age 73, though the rules can vary by birth year, account type, and retirement plan details.
That creates a planning gap.
Not a loophole.
Not a trick.
A window.
And in retirement planning, windows matter because timing can be just as important as the strategy itself.
The Mistake Is Waiting Until the Tax Bill Arrives
The problem is that many people do not think about retirement taxes until something forces the issue.
The first large IRA distribution.
The first RMD.
The first Medicare surcharge.
The first year Social Security becomes taxable.
The first year a surviving spouse files as a single taxpayer.
By then, the options may be narrower.
This is one of the reasons retirement tax planning should not be treated as a once-a-year tax filing exercise. Tax filing looks backward. Planning looks forward.
Your tax return tells you what happened.
Your retirement income timeline helps you decide what to do next.
That distinction matters.
Because the years before RMDs begin may offer more flexibility to decide where income comes from, which assets to reposition, how much ordinary income to recognize, and whether it makes sense to reduce future tax pressure before it becomes mandatory.
How We Evaluate the Retirement Tax Gap
In our planning work, we do not start with the question, “How much should you convert to Roth?”
That question comes later.
We start by building the income timeline.
That means looking year by year at when earned income stops, when Social Security may begin, when pension income starts, when Medicare begins, when RMDs begin, and when taxable portfolio income may change.
Then we look for years where the client has unusual control over taxable income.
That control is the key.
Some retirement income is voluntary. Some is forced. Some is predictable. Some is market-dependent. Some is tied to tax law. Some is tied to health, longevity, or family needs.
The planning opportunity exists when you have enough flexibility to make deliberate decisions before the rules make more of those decisions for you.
A useful retirement tax gap review should ask:
- When does earned income stop or materially decline?
- When do guaranteed income sources begin?
- When do Medicare and RMD rules start to matter?
- Which years offer the most control over taxable income?
- What future tax problem are we trying to reduce?
That last question is important.
The goal is not to create taxable income just because a lower bracket exists. The goal is to determine whether using part of that bracket today may reduce a larger tax problem later.
What Can Be Done During the Window?
The retirement tax window is not about doing one thing.
It is about evaluating several moving pieces together.
For some retirees, that may include Roth conversions. The idea is not simply to convert as much as possible. The better question is whether recognizing income today may reduce the risk of larger taxable IRA distributions later.
But Roth conversions are not automatically the right answer.
A conversion may increase current-year income. It may create a larger tax bill today. It may affect Medicare premiums in a future year because Medicare income-related monthly adjustment amounts are based on modified adjusted gross income. Higher income can increase Part B and Part D premium costs for certain beneficiaries.
That does not mean Roth conversions should be avoided.
It means they should be measured.
For other retirees, the opportunity may be capital gain management. If income is temporarily lower, there may be room to realize gains, diversify a concentrated position, or rebalance a taxable portfolio in a more deliberate way.
For others, it may be asset location. This means looking at which assets belong in taxable accounts, tax-deferred accounts, and Roth accounts so that the overall portfolio is not just invested well, but also distributed tax-efficiently over time.
For charitably inclined retirees, the conversation may eventually include qualified charitable distributions once eligible.
For households delaying Social Security, the years before benefits begin may create a unique planning period. Delaying Social Security beyond full retirement age can increase the eventual retirement benefit through delayed retirement credits, though the right claiming decision depends on health, cash flow, longevity, survivor needs, and the broader plan.
None of these decisions should be made in isolation.
That is the point.
The retirement tax window is valuable because several decisions overlap at once. Income planning, portfolio planning, tax planning, Medicare planning, Social Security planning, estate planning, and cash flow planning all start to interact.
A Simple Example
Consider a married couple who retires at 62.
During their working years, their household income was high. Between salary, bonuses, and investment income, they did not have much room to recognize additional taxable income without pushing themselves into a higher tax bracket.
They retire at 62 and decide to delay Social Security until 67.
They do not have a pension starting immediately. They have taxable savings, traditional IRAs, Roth IRAs, and a brokerage account. Their living expenses are covered partly from cash and partly from taxable investments.
For the first time in years, their taxable income is meaningfully lower.
That five-year period from age 62 to 67 may be one of the most important tax-planning periods of their retirement.
They may have room to convert part of a traditional IRA to a Roth IRA.
They may be able to realize capital gains in a controlled way.
They may be able to diversify appreciated investments without creating the same tax impact they would have faced during their peak earning years.
They may be able to reduce the size of future RMDs.
They may be able to build more tax flexibility for the surviving spouse later in life.
But only if they see the window before it closes.
Because once Social Security begins, pension income starts, portfolio income grows, and RMDs enter the picture, the tax return can fill back up quickly.
That does not mean planning is impossible later.
It just means the easiest planning years may have already passed.
The Window Is Not Always Obvious
One reason people miss this opportunity is that retirement feels like a cash flow event, not a tax event.
Most new retirees are focused on practical questions.
Can I afford to stop working?
Where will my monthly income come from?
How much can I safely spend?
Should I claim Social Security now or later?
How do I avoid running out of money?
Those are the right questions.
But there is another question that should sit beside them:
What will my tax return look like over the next 10 to 15 years?
Not just this year.
Not just next year.
The full timeline.
That timeline may reveal that income is low for a short period, then rises later. Or it may reveal that income looks manageable while both spouses are alive, but becomes less efficient for the surviving spouse. Or it may show that doing nothing today could create larger forced distributions later.
This is where retirement tax planning becomes more than tax preparation.
It becomes coordination.
The Goal Is Not to Pay the Lowest Tax This Year
This is important.
Good retirement tax planning is not always about minimizing this year’s tax bill.
Sometimes the lowest tax bill today creates a higher lifetime tax cost later.
That can happen when retirees avoid taking IRA distributions in their 60s, only to face larger RMDs in their 70s. It can happen when a married couple fails to plan for the surviving spouse’s future tax brackets. It can happen when Medicare surcharges, Social Security taxation, capital gains, and retirement distributions all collide in the same year.
The better goal is not to avoid tax at all costs.
The better goal is to manage taxes over a lifetime.
That requires looking at the sequence of income, not just the amount of income.
It also requires humility.
Tax laws can change. Investment returns will not follow a straight line. Health needs, family needs, and spending needs may evolve. A good plan should be flexible enough to adjust as the facts change.
Before You Make a Move, Ask Better Questions
The retirement tax gap can create planning flexibility, but flexibility is not the same thing as certainty.
Before making a Roth conversion, realizing capital gains, delaying Social Security, or drawing from one account instead of another, it is worth asking:
What tax bracket are we filling today?
What future tax bracket are we trying to avoid?
Could this decision affect Medicare premiums?
Does this create enough cash flow for the next few years?
How does this affect the surviving spouse?
Are we coordinating this with the investment plan, estate plan, and charitable plan?
That is the difference between a tax move and a retirement strategy.
A tax move looks at one transaction.
A retirement strategy looks at the sequence of decisions.
Start Before the First RMD
The retirement tax window most people miss is not hidden because it is complicated.
It is hidden because it arrives during a transition.
You are leaving work.
You are figuring out cash flow.
You are deciding when to claim benefits.
You are adjusting to a new rhythm of life.
And in the middle of that transition, there may be a short period when your tax picture gives you more room to plan than you had before and may have again.
That is why retirement tax planning should begin before the first RMD shows up.
Before Social Security is automatically deposited.
Before Medicare premiums surprise you.
Before the tax return starts telling you what you should have planned for years earlier.
The starting point is simple:
Build your retirement income timeline.
Look at when earned income stops, when Social Security may begin, when pension income starts, when RMDs begin, and when large taxable events may occur.
Then ask what can be done in the lower-income years to create more flexibility later.
Because in retirement, the best tax move is not always found after the problem appears.
Sometimes it is found in the quiet years before everyone else starts paying attention.
This material is for educational purposes only and should not be treated as personalized tax, legal, or investment advice. Retirement tax strategies should be evaluated in light of your full financial picture and coordinated with your tax professional before implementation.

The New Senior Deduction Most People Don’t Know About
Most retirees know about the standard deduction.
Some know there’s already an extra standard deduction once you reach age 65.
But beginning in 2025, there’s another senior tax deduction that many people may not know about yet.
The One Big Beautiful Bill Act created a temporary additional deduction for taxpayers age 65 and older. For 2025 through 2028, eligible taxpayers may be able to claim up to an additional $6,000 per person. For a married couple where both spouses qualify, that could mean up to $12,000 in additional deductions.
And this is on top of the existing senior standard deduction already in the tax code.
According to the IRS, the deduction applies from 2025 through 2028, is available to taxpayers age 65 and older, and begins phasing out when modified adjusted gross income exceeds $75,000 for single filers or $150,000 for married couples filing jointly. The IRS also notes that the deduction is available to eligible taxpayers whether they itemize or claim the standard deduction.
Now, that may sound like a simple tax break.
But for retirees, it could be more than that.
It could change the math on Roth conversions, IRA withdrawals, capital gains, and how much taxable income you can recognize before the tax cost starts to climb.
Why This Matters
Retirement tax planning is often about finding windows.
There may be a window after you stop working but before Social Security begins.
There may be another window before pensions start.
And there may be a window before required minimum distributions begin.
For some retirees, these years can be especially valuable because taxable income may be lower than it was during the working years and lower than it may be later in retirement.
That matters because lower-income years can create flexibility.
You may be able to convert part of a traditional IRA to a Roth IRA.
You may be able to realize capital gains at a lower tax cost.
You may be able to reposition assets before required minimum distributions begin.
And you may be able to fill up a tax bracket intentionally instead of letting future income push you into a higher one later.
That’s where this new senior deduction comes in.
For taxpayers age 65 and older, the deduction may create another layer of flexibility during a limited planning window.
Now, that doesn’t mean everyone should immediately do a larger Roth conversion.
It doesn’t mean the deduction eliminates taxes.
And it doesn’t mean every retiree will qualify for the full amount.
Instead, the better planning question is this:
Does this deduction change how much income I can recognize before I cross an important tax threshold?
That’s where the planning value may show up.
The Deduction Isn’t the Strategy
One of the mistakes people make with tax planning is looking at a new rule in isolation.
A new deduction shows up, and the instinct is to ask, “How do I use it?”
But that’s not always the right starting point.
In retirement tax planning, the deduction is only one input. The real question is how it affects the broader income plan.
That means looking at the deduction alongside Roth conversion sizing, traditional IRA withdrawals, capital gains, Social Security taxation, Medicare IRMAA thresholds, required minimum distributions, charitable giving, and surviving spouse tax exposure.
That’s where this new senior deduction becomes more interesting.
It may not change the entire plan.
But it may change the margin.
And in retirement tax planning, the margin matters.
A few thousand dollars of additional deduction may determine whether more IRA money can be converted at an acceptable tax cost. It may reduce the tax drag on income that was already going to be recognized. Or it may create a little more room before a taxpayer bumps into a bracket, phaseout, or other income-sensitive threshold.
That’s why this should be modeled, not guessed at.
A Simple Example
Consider a married couple, both age 66.
They recently retired. They haven’t started required minimum distributions yet. They’re delaying Social Security. And for the next few years, they’re living partly from cash reserves and taxable investments.
They also have a meaningful balance in traditional IRAs.
Suppose their projected taxable income before Roth conversions is $90,000.
Before the new senior deduction, their tax projection may have suggested converting only a certain amount from their IRA to a Roth IRA while staying within a target taxable income range.
But now, from 2025 through 2028, this couple may have up to $12,000 of additional deductions available because both spouses are over age 65.
That doesn’t make a Roth conversion tax-free.
But it may allow them to recognize more income before reaching the same taxable income level they would have reached under the old rules.
For example, if they were originally planning a $50,000 Roth conversion, the new deduction may reduce the taxable impact of that conversion. Or, if their goal was to fill a specific tax bracket without going beyond it, the deduction may allow them to convert somewhat more than they otherwise could have.
Of course, the exact number would depend on their full tax return.
Their Social Security income, pension income, capital gains, charitable giving, deductions, and modified adjusted gross income all matter.
But the planning point is still important.
The same Roth conversion that looked slightly too large before may now fit more comfortably inside the plan.
Or, if they were already planning to convert a set amount, the new deduction may reduce the tax cost of that conversion.
That’s why the new rule matters.
It’s not just a deduction sitting on a tax return.
It can affect the retirement income plan.
How We’d Evaluate This in a Retirement Tax Projection
When looking at a rule like this, the first step isn’t to assume it creates an opportunity.
The first step is to test it.
In a retirement tax projection, we’d want to answer several questions.
First, does the taxpayer qualify based on age and filing status?
The deduction is tied to taxpayers age 65 and older. For married couples, the $12,000 maximum applies when both spouses qualify. If only one spouse qualifies, the maximum benefit may be lower.
Second, is the deduction fully available or partially phased out?
This matters because the phaseout begins once modified adjusted gross income exceeds the applicable threshold. So, a taxpayer with significant IRA withdrawals, capital gains, pension income, or Roth conversions may reduce or lose part of the benefit.
Third, what income would have been recognized anyway?
If a retiree was already planning IRA withdrawals, capital gains, or a Roth conversion, the deduction may reduce the tax cost of income already built into the plan.
Fourth, does the deduction create more room for strategic income?
This is where Roth conversions come into the picture. The additional deduction may allow some taxpayers to convert more IRA assets before reaching the same taxable income target.
Fifth, what other thresholds are affected?
This is where the analysis can get more complicated.
A Roth conversion may reduce future RMDs, but it can also increase modified adjusted gross income today. Capital gains may be taxed favorably, but they can still affect other parts of the return. And Medicare IRMAA thresholds may be based on income measures that don’t always move the same way as taxable income.
Finally, what happens after 2028?
Because the deduction is scheduled to be temporary, it should be viewed as part of a limited planning window. The question isn’t only whether the deduction helps this year. The question is whether it changes the sequence of decisions between 2025 and 2028.
That’s the difference between tax preparation and tax planning.
Tax preparation reports what happened.
Tax planning asks what should happen next.
Where This Can Show Up
The most obvious place this deduction may matter is Roth conversion planning.
For retirees in their 60s and early 70s, Roth conversions are often evaluated year by year. The goal isn’t simply to convert as much as possible. The goal is to convert the right amount based on current tax rates, future required minimum distributions, Social Security taxation, Medicare premiums, estate goals, and survivor-tax exposure.
A new deduction changes one input in that calculation.
But Roth conversions aren’t the only area affected.
This deduction may also matter when deciding whether to realize capital gains, especially for retirees managing appreciated taxable investments.
It may matter when choosing whether to draw from an IRA, a taxable account, or cash.
It may matter when coordinating charitable giving strategies, including whether qualified charitable distributions may become more attractive later.
And it may matter for taxpayers who are trying to manage income around Medicare surcharge thresholds.
That last point is important.
The deduction may reduce taxable income, but retirees still need to pay attention to modified adjusted gross income, especially when Medicare IRMAA thresholds are involved. A deduction may help with the income tax calculation, but it doesn’t automatically make every income-related threshold disappear.
This is where many retirement tax mistakes happen.
People look at one tax benefit in isolation.
But retirement tax planning doesn’t work in isolation.
Your IRA withdrawal affects your taxable income.
Your taxable income can affect how much of your Social Security is taxed.
Your modified adjusted gross income can affect Medicare premiums.
Your Roth conversion can reduce future required minimum distributions but increase this year’s tax bill.
And your capital gains can look manageable until they interact with everything else on the return.
So, while the new senior deduction may create an opportunity, it still needs to be modeled inside the full retirement income plan.
Three Questions to Ask Before Using the New Senior Deduction
Before making a Roth conversion, IRA withdrawal, or capital gain decision around this deduction, there are three questions worth asking.
#1 Will I Actually Qualify for the Deduction?
The maximum deduction isn’t the same as the available deduction.
Age matters.
Filing status matters.
Modified adjusted gross income matters.
And for higher-income retirees, the phaseout may reduce or eliminate the benefit.
That means the first step isn’t estimating the deduction in isolation. The first step is estimating income for the year and seeing whether the deduction is still available after all other income is included.
#2 What Income Should I Recognize While the Deduction Exists?
If the deduction creates more room, the next question is how to use that room.
For some retirees, the best answer may be a larger Roth conversion.
For others, it may be realizing capital gains.
For others, it may be taking IRA distributions earlier than required to reduce future RMD pressure.
And for some, the best answer may be to do nothing because the additional income would create other tax or Medicare issues.
That’s why context matters.
The deduction doesn’t tell you what to do.
It simply changes the tax math around the decision.
#3 What Future Problem Am I Trying to Reduce?
This is the most important question.
A Roth conversion isn’t valuable simply because there’s room to do one. It’s valuable if it helps reduce a future tax problem.
That future problem could be large required minimum distributions.
It could be higher taxable income after Social Security and pensions begin.
It could be the surviving spouse eventually filing as a single taxpayer.
It could be heirs inheriting pre-tax retirement accounts.
Or it could be a lack of tax flexibility later in retirement.
Without a clear future problem to solve, the deduction can become a distraction.
But with a clear future problem, it can become a useful planning tool.
The Temporary Nature Matters
There’s another reason this deserves attention.
The deduction is temporary.
As currently structured, it applies for 2025 through 2028.
That means it may create a four-year planning window for eligible taxpayers.
And temporary windows are often where tax planning becomes most valuable.
If you’re 65 or older during this period, the question isn’t just whether you qualify this year. It’s whether the deduction changes the sequence of decisions you make over the next several years.
Should you convert more IRA money before required minimum distributions begin?
Should you realize gains while your taxable income is lower?
Should you draw from pre-tax accounts now to reduce pressure later?
Should you delay or accelerate income based on where you fall relative to the phaseout range?
Should you revisit a plan that was built before this deduction existed?
These aren’t generic questions.
They depend on your income, your assets, your filing status, your age, your Social Security timing, your Medicare status, your charitable intent, and your long-term goals.
But the key point is simple.
If your retirement tax plan was built before this new senior deduction, then it may already be outdated.
Don’t Chase the Deduction
That said, this isn’t something to chase blindly.
A $6,000 deduction, or even a $12,000 deduction for a married couple, is meaningful. But it shouldn’t drive the entire plan.
Sometimes, doing a larger Roth conversion still doesn’t make sense.
Sometimes, staying below a Medicare surcharge threshold matters more.
Sometimes, preserving liquidity is more important than accelerating income.
Sometimes, future tax savings aren’t worth the current tax cost.
And sometimes, the deduction phases out before it provides much benefit at all.
That’s why the planning process matters.
The deduction is an input.
It’s not the strategy.
The strategy is deciding how to use your lower-income retirement years wisely before future income becomes less flexible.
The Bottom Line
The new senior deduction is easy to overlook.
But for taxpayers age 65 and older, it may change the tax math from 2025 through 2028.
For some retirees, it may reduce the tax cost of income they were already planning to recognize.
For others, it may create additional room for Roth conversions, IRA withdrawals, or capital gains.
And for many, it should be a reason to revisit the retirement income plan before making year-end tax decisions.
The goal isn’t to chase a deduction.
The goal is to understand whether this temporary rule gives you more flexibility while the window is open.
Because in retirement tax planning, the best opportunities often show up before they become obvious.
And by the time required minimum distributions, Social Security, pensions, and Medicare surcharges are all in motion, the easiest planning window may already be gone.
This article is for educational purposes only and should not be treated as personalized tax advice. The new senior deduction should be evaluated with your tax advisor before making Roth conversion, withdrawal, capital gain, or charitable giving decisions.

Why Diversification Feels Broken Right Before It Works
Diversification can feel like a mistake when one part of the market is doing all the work.
That's the part investors don’t always appreciate.
Diversification is easy to believe in when everything's working. It's much harder to believe in when a narrow group of stocks is carrying the market higher and the rest of your portfolio feels like dead weight.
That's when the questions start.
Why own bonds?
Why own value stocks?
Why own international stocks?
Why own anything other than the part of the market that's clearly winning?
Those are fair questions. They're also the exact questions that tend to show up right before diversification matters most.
In our portfolio work, we don’t treat diversification as a prediction tool. It's a risk-management discipline. It's not there because we know exactly which part of the market will lead next. It's there because we don’t.
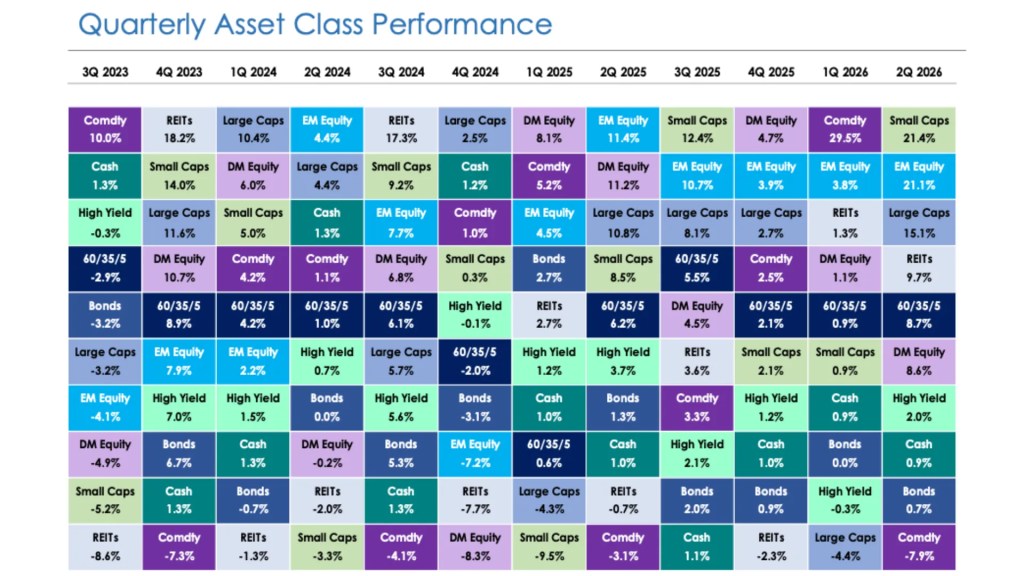
Diversification Isn’t Supposed to Feel Good All the Time
The purpose of diversification isn’t to beat the hottest asset class every year.
It's not designed to make every part of your portfolio look smart at the same time. It's not designed to keep up perfectly with whatever corner of the market is leading today. And it's not designed to eliminate frustration.
In fact, a diversified portfolio almost always owns something that feels disappointing.
That's not a flaw. That's the tradeoff.
If every part of your portfolio is working at the same time, there's a good chance your portfolio isn’t as diversified as you think. You may simply own different versions of the same risk.
True diversification means owning investments that behave differently under different conditions.
Some may lead when growth stocks are in favor.
Some may help when interest rates fall.
Some may provide stability when stocks are under pressure.
Some may become useful when market leadership broadens beyond the same small group of winners.
But because those investments behave differently, they won’t all work at once.
That's what makes diversification frustrating.
It's also what makes it valuable.
Diversification doesn’t guarantee a profit or protect against loss. No portfolio strategy can do that. But it can reduce the risk that one market segment, one economic outcome, or one investment theme determines the entire result of your plan.
That distinction matters.
The Problem Starts With Comparison
The hardest part of diversification isn’t the math.
It's the comparison.
When large-cap growth stocks lead for a long stretch of time, a balanced portfolio can feel too cautious. When a handful of companies are responsible for most of the market’s gains, anything outside of those companies can feel unnecessary. When the index keeps moving higher and your portfolio is moving more slowly, discipline starts to feel like a drag.
That's usually when investors begin to second-guess the plan.
At first, it's just an observation.
Then it becomes a question.
Then it becomes frustration.
And eventually, it can become action.
That's where investors get into trouble.
Because the decision to abandon diversification rarely feels reckless in the moment. It often feels rational. It feels like responding to the evidence. It feels like finally admitting what's been obvious for a while.
Why own the laggards when the winners are right there?
But that line of thinking can quietly turn a long-term investment plan into a performance chase.
And performance chasing has a way of showing up late.
Market Leadership Doesn’t Last Forever
The problem with chasing what's working now is that market leadership changes.
It doesn’t always change quickly. It doesn’t always change when valuations suggest it should. And it doesn’t always change in a way that feels obvious ahead of time.
But it changes.
That's why diversification exists in the first place.
It's not an admission that returns don’t matter. It's an acknowledgment that the future is uncertain.
Think about a period when large-cap growth stocks have led the market for several years. In that environment, a portfolio that also owns value stocks, small caps, international equities, or high-quality bonds may lag the most visible market benchmark.
The investor may look at the portfolio and feel like too many pieces aren’t pulling their weight.
Then conditions shift.
Interest rates move.
Earnings leadership broadens.
Valuations begin to matter again.
The economy slows, reaccelerates, or changes in a way investors didn’t expect.
Suddenly, the parts of the portfolio that looked unnecessary may become the source of stability, income, or return.
That doesn’t mean every diversifying asset will work perfectly. It doesn’t mean a diversified portfolio will avoid losses. And it doesn’t mean diversification will protect against every bad outcome.
But it does mean the portfolio isn’t dependent on one narrow market outcome continuing forever.
That's the point.
A concentrated portfolio feels best when the concentrated bet is working.
A diversified portfolio can feel less exciting during narrow leadership.
But when leadership changes, the difference matters.
Concentration Risk Often Feels Best Right Before It Matters
One of the reasons diversification is so difficult is that concentration risk can feel rewarding for a long time.
That's what makes it dangerous.
When one asset class, sector, or stock keeps leading, concentration doesn’t feel like risk. It feels like confirmation. The investor feels rewarded for having more exposure to the winners and less exposure to everything else.
This can be especially challenging for investors with concentrated company stock, equity compensation, or large positions that have appreciated over many years. The position may have created meaningful wealth. It may still be a high-quality company. It may still have a strong long-term story.
I worked with a client recently who was heading into retirement with a large share of their net worth sitting in company stock. They'd watched that stock grow across their entire career. Selling any of it felt like betting against their own success story.
I told them about a group of people I met years ago when I worked in Saint Louis. Most were former employees of Wachovia, and many were approaching retirement in 2008. Like my client, a large portion of their retirement savings sat in company stock. When the financial crisis hit and Wachovia collapsed, their savings went with it. Years of disciplined saving disappeared in a matter of months, not because they'd done anything wrong, but because their financial future depended entirely on one company continuing to succeed.
That story isn’t meant to scare anyone away from company stock. It's meant to separate two different questions. The first is, “Has this position performed well?” The second is, “What happens to my retirement plan if it stops?” My client’s stock may still have a bright future. But their retirement plan shouldn’t require it to.
For a deeper look at how to evaluate whether you’re sitting on a concentrated position and what to do about it, see Don’t Keep All Your Eggs in One Basket.
But none of that eliminates concentration risk.
A great company can still become an oversized position.
A strong sector can still become overowned.
A successful investment can still become too important to the family’s financial future.
That's why diversification isn’t just an investment concept. It's a planning concept.
The question isn’t simply, “What has performed best?”
The better question is, “How much of my financial life depends on this one thing continuing to work?”
That's a different question.
And for high-net-worth families, retirees, and investors with concentrated wealth, it's often the more important one.
The Risk Isn’t Just Losing Money
The risk isn’t simply that the market pulls back.
The bigger risk is that investors make a permanent decision based on a temporary environment.
That matters because most families aren’t investing for entertainment, ego, or quarterly bragging rights.
They're investing to support a retirement income plan.
To fund education.
To manage concentrated stock exposure.
To preserve liquidity.
To reduce the risk of being forced to sell at the wrong time.
To keep their broader financial life moving in the right direction.
For those investors, the portfolio has a job.
Its job isn’t to win every short-term comparison.
Its job is to support the plan.
That means some parts of the portfolio may look unnecessary for a while. Some may lag. Some may feel boring. Some may be hard to appreciate when the market’s favorite trade is working.
But every allocation should have a purpose.
Growth assets are there for long-term appreciation.
Defensive assets are there for stability and liquidity.
Income-producing assets are there to support cash flow.
Diversifying assets are there because the future doesn’t always look like the recent past.
The question isn’t whether every piece is outperforming today.
The question is whether the total portfolio is built to survive different market environments.
Diversification Has to Be Judged Against the Plan
A diversified portfolio shouldn’t be judged only against the market’s current favorite.
It should be judged against the plan it was built to support.
That includes the investor’s time horizon, spending needs, withdrawal strategy, tax situation, liquidity needs, risk tolerance, and ability to stay invested when markets become uncomfortable.
For an accumulator, diversification may be about avoiding overdependence on one source of return.
For a retiree, it may be about managing sequence-of-return risk and maintaining enough stability to support withdrawals during difficult markets.
For an executive with equity compensation, it may be about reducing the risk that career income, company stock, and long-term wealth are all tied to the same business outcome.
For a family stewarding generational wealth, it may be about preserving flexibility across market cycles rather than maximizing exposure to the latest winner.
The right portfolio isn’t the one that looks best in hindsight.
It's the one the investor can actually live with, fund goals from, and stick with when the environment changes.
That's where diversification earns its place.
Not because it always feels good.
Because it helps keep the plan from depending on one version of the future.
Don’t Confuse Frustration With Failure
There will always be moments when diversification feels broken.
There will always be a stock, sector, asset class, or theme that makes the disciplined portfolio look dull by comparison.
And there will always be investors who are tempted to simplify the portfolio around whatever's worked best recently.
But temporary frustration isn’t the same thing as strategic failure.
Sometimes diversification feels broken because one part of the market has dominated for a long period of time.
Sometimes it feels broken because the benefit hasn’t been needed yet.
Sometimes it feels broken because the thing it's designed to protect against hasn’t happened.
That doesn’t make it useless.
It makes it easy to underappreciate.
The real test of diversification doesn’t come when the market’s current favorite is still leading. It comes when leadership changes, when expectations shift, when volatility returns, or when investors are reminded that no single trade works forever.
By then, it may be too late to rebuild the portfolio without paying a price.
So don’t judge diversification by whether it keeps up with the market’s current favorite.
Judge it by whether your portfolio can survive a change in leadership.
Because by the time diversification feels obvious again, the opportunity to stay disciplined may have already passed.
July Market Update: A Loud Month, a Quiet Market
July gave investors plenty to think about.
Geopolitical tensions flared again in the Middle East. AI stocks pulled back after a strong start to the year. And the Federal Reserve had another rate decision to make.
Yet when the month was over, the market had barely moved.
The S&P 500 returned -0.1%.
Beneath that flat headline, though, there was quite a bit going on. Energy led every sector with a +12.6% return as geopolitical tensions pushed oil prices higher. Financials followed at +6.2%. The more defensive corners of the market held up well too, with Real Estate (+2.5%), Health Care (+2.4%), and Consumer Staples (+2.1%) all gaining ground.
Technology was the outlier. The sector fell -3.4% as AI stocks gave back some of the gains they'd built up earlier in the year.
Bonds had a tougher month.
The U.S. Aggregate Bond Index returned -1.3% as Treasury yields moved higher. The culprit was familiar: rising oil prices, tied to the renewed U.S.-Iran conflict, brought inflation concerns back to the surface. Investment-grade corporate bonds lagged with a -1.5% return, while high-yield corporates held up a bit better at -0.3%.
Overseas, the picture was mixed. Developed international markets gained +2.0% and outperformed the S&P 500. Emerging markets went the other way, returning -3.0%, as the same U.S. tech selloff weighed on South Korean stocks.
Markets Turn Back to the Middle East as Tensions Resurface
The ceasefire from earlier this spring didn't hold.
Renewed conflict between the U.S. and Iran brought back the same headlines and the same concerns we saw earlier in the year. Once again, uncertainty around the Strait of Hormuz raised the risk of reduced oil supply. Late in the month, there were signs of another round of de-escalation, but the situation remains fluid.
This matters for the same reason it did the first time around.
After all, energy prices feed directly into inflation. And inflation, in turn, shapes what the Federal Reserve decides to do next.
In July, the Fed held interest rates steady for the fifth consecutive meeting. But it wasn't a unanimous call. A handful of officials pushed for a +0.25% rate hike, pointing to the renewed inflation risk.
If this feels familiar, that's because it is.
We've now moved through this same cycle several times this year. Conflict escalates. Oil prices rise. Tensions ease. And then the pattern repeats. The specific headlines shift from week to week, but the market has absorbed this same shock more than once.
The Fed's split decision reflects that uncertainty. Officials are debating their next move, but for now they're choosing to gather more information rather than react to the latest headline.
And here's the part worth remembering: despite all the noise, the net impact on markets has been limited. Stocks rebounded from the March selloff, and the S&P 500 has returned nearly +10% this year.
AI Stocks Trade Lower as Investors Shift Focus from Growth to Discipline
Second-quarter earnings season kicked off in July, and the biggest names in AI all reported: Alphabet, Microsoft, Meta, Apple, and Amazon.
These are the companies pouring money into data centers and the other infrastructure needed to power artificial intelligence. This quarter, they laid out their forecasts and their spending plans.
Something had changed in how investors received them.
For the past two years, the AI conversation was all about scale. How much are these companies spending? How fast are they building? How big could the opportunity get? This quarter, the focus shifted to a different question: profitability and return on investment.
In plain English, investors started pushing back on the spending.
Companies whose investments are clearly translating into growth, like Microsoft's cloud business, were rewarded. Companies whose spending has outpaced their cash flow, or started to weigh on profit margins, saw their stocks move lower.
The market is no longer content to reward growth and big spending numbers on their own. It's asking a harder question: is the spending actually profitable, or are expenses climbing faster than revenue?
This is a healthy development.
Every major technological buildout eventually reaches a point where investors stop rewarding growth for its own sake and start looking for results to match. July was the month that question arrived for AI.
As that scrutiny set in, semiconductor stocks and other parts of the AI trade gave back some of their earlier gains, with investors questioning whether the current pace of spending could last.
But it's worth keeping the pullback in perspective.
The volatility stayed relatively contained. For instance, the equal-weight S&P 500, a proxy for the average S&P 500 stock, set a new all-time high late in the month, and seven of the eleven sectors finished higher. Credit spreads, which measure how worried the market is about credit risk, widened only modestly and remain very tight by historical standards. And even after the pullback, semiconductor stocks are still up nearly +60% for the year.
As for the companies doing the spending? They're forecasting even higher spending levels in the quarters ahead.
What This Means for Investors
July was a busy month that, on the surface, went almost nowhere.
Geopolitical tension returned. AI leadership wobbled. The Fed stood pat, but not without disagreement. And through all of it, the S&P 500 finished essentially flat.
That's a useful reminder.
A lot can happen in a month without much of it showing up in your account balance. The headlines were loud, but the market's response was measured, and in some ways more disciplined than it's been in a while.
That discipline is the theme worth holding onto. Whether it's a geopolitical shock the market has already learned to absorb, or a shift toward asking harder questions about AI spending, the through-line is the same. Markets are starting to separate noise from results.
For long-term investors, that's not something to fear. It's something to build around.