

The Pennsylvania Roth Conversion Advantage
Most retirees treat state income tax as a footnote in the Roth conversion decision.
What federal bracket am I in today? How large will my required distributions get? How much can I convert without creating unnecessary Medicare costs?
Those are important questions, certainly.
But if you live in Pennsylvania and expect to move someday, there's another question that can change the math: Where will you live when these retirement dollars finally come out?
Because your answer could decide when you convert.
Pennsylvania Leaves Your IRA Alone
To be sure, Pennsylvania treats retirement money differently than the IRS does.
That’s because when you convert a traditional IRA to a Roth, the IRS taxes every pre-tax dollar that year. The Pennsylvania Department of Revenue, on the other hand generally doesn't.
And once you're 59½, Pennsylvania doesn't tax your traditional IRA withdrawals either.
Put those two rules together, and Pennsylvania takes nothing whether you convert or not.
So if you're staying in Pennsylvania, state tax isn't a factor in your Roth decision. The decision rests entirely on federal math like, your federal rate future required distributions, when Social Security begins and the like.
Pennsylvania only becomes a factor when you plan to leave.
The Opportunity Appears When You're Planning to Move
How so?
Well, suppose you expect to leave Pennsylvania in a few years to be closer to family, and your new state taxes IRA withdrawals.
Now you have a situation where there's a state tax to avoid.
On the other hand, if you convert while you're a Pennsylvania resident, then state takes nothing.
Wait until after the move, and your new state taxes your withdrawals.
And here’s the best part: Your IRA doesn't remember where you earned it.
Federal law says only the state you live in when the money comes out can tax it.
So then, once you leave Pennsylvania, your new state is the one with the claim. Note: the opposite also applies.
That's the real Pennsylvania Roth conversion advantage.
It isn't simply that Pennsylvania is tax-friendly.
Now here’s the thing, Pennsylvania doesn’t give you a few years to convert without a state tax bill.
That window closes the day you move.
While you're a resident of another state, you lose the benefit of Pennsylvania's tax treatment and become subject to that state's rules.
Consider a Pittsburgh Couple Planning to Move
Consider, for example, a hypothetical couple, both 63.
They recently retired in Pittsburgh with most of their savings in traditional IRAs. They plan to stay about four more years before moving closer to their grandchildren.
Their future state taxes IRA withdrawals. For simplicity, let's say those dollars would face a state tax rate of about 5%.
The first thing I wouldn't do is tell them to start converting $100,000 a year.
We start with the retirement-income timeline.
When does their paycheck stop completely?
When will Social Security begin?
How much income will their taxable portfolio produce?
How much will they need from their investments to support their lifestyle?
When will required minimum distributions begin?
What does their federal tax picture look like year by year?
And now there's another date on that timeline: When do they stop being Pennsylvania residents?
Only after we build that baseline do we start testing conversion amounts.
So then, let's say our analysis shows that converting $100,000 a year for four years fits their target federal bracket without creating side costs big enough to undo the benefit. They pay the tax from cash, so the full amount goes to work in the Roth.
Over four years, they convert $400,000.
The IRS still gets its share. Pennsylvania takes nothing.
Now consider the alternative.
They leave the same $400,000 in their traditional IRAs and withdraw it after they've moved.
At an illustrative 5% state rate:
$400,000 × 5% = $20,000.
That's about $20,000 in state tax on the same $400,000 of retirement money.
This example isolates the state-tax question on purpose. It assumes their federal rate would be about the same either way.
Real planning is messier.
Investment growth, federal brackets, deductions, Medicare premiums, Social Security taxation, future tax law, their new state's rules and the timing of withdrawals can all change the result.
The $20,000 isn't the conclusion.
It's the signal that there's something worth modeling.
This Changes How I Build the Conversion Timeline
Indeed, this is where knowing a tax rule and doing tax planning part ways.
Because knowing Pennsylvania doesn't tax the conversion is information.
The planning work is figuring out whether that fact matters for your household.
To be sure, in our planning process, we don't start with "How much should you convert?"
We start with the income timeline.
I want to see what your tax return could look like over the next 10 or 15 years before we deliberately add income to it.
We map when your paycheck stops, when Social Security and pensions start, and when Medicare enters the picture. We map when required distributions begin, how much your portfolio needs to provide, and how big your traditional IRA could get if we do nothing.
Then we model different conversion schedules.
One might involve no conversions.
Another might fill the remaining room in a target bracket.
Another might cross into the next bracket on purpose because the long-term result still looks better.
For a Pennsylvania client planning to relocate, I'd add one more point: What changes if we finish more of the conversions before the move?
This isn't just theory. Research by Edward McQuarrie and James DiLellio in the Journal of Financial Planning shows that conversion results hinge on your tax rate today versus later, how long the money has to grow, and where the cash to pay the tax comes from.
A move adds another tax rate to that math.
So then, instead of treating the move as a lifestyle decision over here and the conversion as a tax decision over there, we put them on the same timeline.
That's the coordination.
I'd Work Backward From the Move Date
Once a client has a real relocation plan, the analysis gets sharper.
For our couple, the move is about four years out.
Now we know the conversion window isn't unlimited.
We can work backward and start asking question like:
- What does taxable income look like this year?
- How much room is there before the next federal bracket?
- Will the added income trigger a Medicare surcharge down the road?
- Will Social Security start before the move?
- Is there cash on hand to pay the conversion tax instead of withholding it from the IRA?
- Could investment gains or losses change how much we want to convert?
- Should we convert the same amount each year, or does one year have a lot more room than another?
- And how sure are we about the move?
That last question matters.
Because tax planning shouldn't be built around a move you've only daydreamed about.
But if you've picked the destination, bought property or set a date, the move belongs in the plan.
Your move date can matter as much as your federal bracket.
The State-Tax Advantage Still Doesn't Make Every Conversion a Good Conversion
Now, none of this means you should convert as much as possible before you leave if you’re planning to move out of a tax-advantaged state like Pennsylvania.
Indeed, saving 5% in future state tax doesn't justify paying a much higher federal rate today, if there isn’t a long-term net gain.
Maybe another $100,000 would push a big chunk of income into a higher bracket with no net benefit.
Maybe it triggers a Medicare surcharge.
Maybe paying the tax would drain cash you need for the first few years of retirement.
Maybe your new state has its own break for retirement income.
Or maybe you're moving to a state with no income tax at all, where there's no state bill to get ahead of.
Any of those can shrink the advantage or erase it.
That's why I wouldn't compare Pennsylvania's zero to another state's headline rate and call the difference "savings."
Your new state's actual rules matter.
Your federal return matters.
The timing matters.
And the amount you convert matters.
A Roth conversion is still a multi-year tax decision, not a state-tax arbitrage trade.
Your Move Date Can Become Part of Your Retirement Tax Window
Now, i've written before about what I call the income tax valley. It's the stretch after your paycheck stops but before Social Security and required distributions start filling up your tax return.
For many retirees, those years offer rare control over how much taxable income they report.
A planned move out of Pennsylvania adds a second boundary to that window.
You have the federal window that retirement creates.
And inside it, you may have a Pennsylvania window. Inside that window, your conversion only answers to the IRS.
That changes how I think about the planning horizon.
Think back to our couple. They retired at 63, plan to move around 67, and won't face required distributions for years after that.
The question isn't just: How much can we convert before RMDs?
It becomes: How much, if any, should we convert before leaving Pennsylvania?
Those are different questions.
And the second one has an earlier deadline.
The Goal Isn't to Avoid State Tax at Any Cost
When it comes down to it, good retirement tax planning isn't about finding one tax to dodge and rebuilding your plan around it.
It's about coordinating the decisions you already expect to make.
Because if you're staying in Pennsylvania, the state's treatment of conversions won't tip your decision, given that your IRA withdrawals get the same break.
But if you already expect to move, leaving residency out of the analysis leaves out a variable that matters.
That's why the conversion decision should include more than your current bracket.
It should include your retirement-income timeline.
Your future required distributions.
Your Social Security and Medicare decisions.
Your cash-flow needs.
And, when it's relevant, where you'll live.
Because Pennsylvania gives you the rule.
But proper planning tells you whether the rule is worth using.
The Bottom Line
Pennsylvania doesn't tax your Roth conversion. Once you're 59½, it doesn't tax your IRA withdrawals either.
So staying put doesn't create a special state-tax reason to convert.
Planning to leave might.
What this means is that if you're moving to a state that taxes retirement income, don't build your conversion timeline around your federal bracket alone.
Put your move date on the same timeline.
Then find out how much of your tax window closes when you cross the state line.
Related Reading
A Roth Conversion Is Not the Goal
The Retirement Tax Window Most People Miss
Five Reasons Why a Roth Conversion Might Be Right for You
The Tax Bill You're Leaving Your Kids
Sources
Pennsylvania Department of Revenue, "Taxability of Roth IRAs According to PA Income Tax Rules."
https://revenue-pa.custhelp.com/app/answers/detail/a_id/274/~/taxability-of-roth-iras-according-to-pa-income-tax-rules
Pennsylvania Department of Revenue, PA Personal Income Tax Guide: Gross Compensation.
https://www.pa.gov/agencies/revenue/forms-and-publications/pa-personal-income-tax-guide/gross-compensation
Internal Revenue Service, Publication 590-A, Contributions to Individual Retirement Arrangements (IRAs).
https://www.irs.gov/publications/p590a
Edward F. McQuarrie and James A. DiLellio, "The Arithmetic of Roth Conversions," Journal of Financial Planning, May 2023.
https://www.financialplanningassociation.org/learning/publications/journal/MAY23-arithmetic-roth-conversions-OPEN
Michael Kitces, "Why Moving To A Lower-Tax State Doesn't Always Result In Lower Taxes On Deferred Income."
https://www.kitces.com/blog/moving-lower-tax-state-income-employee-stock-options-iso-nonqualified-deferred-compensation/
Michael Kitces, "Harvesting Capital Gains Vs. Roth Conversions At 0% Tax Rates." https://www.kitces.com/blog/navigating-income-harvesting-strategies-harvesting-0-capital-gains-vs-partial-roth-conversions/


The First Monday With Nowhere to Be
You spent years thinking about that last Friday.
The last commute.
The last meeting.
The last time you closed the laptop because someone else expected you to be somewhere Monday morning.
Maybe there was a retirement party.
Maybe a long-awaited trip came next.
Maybe you finally tackled a few things around the house.
And then, eventually, an ordinary Monday arrives.
You wake up at six because your body still thinks it has somewhere to be.
By ten, the morning feels unusually long. Tuesday looks suspiciously like Monday.
For the first time in decades, nobody else has decided what your week is supposed to look like.
That empty calendar may seem like a lifestyle issue.
It is also a financial-planning issue.
Because the retirement income plan you spent years preparing will ultimately be lived through those empty Mondays. The restaurants, trips, home projects, gifts to family, hobbies, vehicles and everyday purchases that follow are what turn an annual withdrawal assumption on a spreadsheet into an actual retirement.
And that is why I believe one of the most overlooked questions in retirement planning is not simply, “How much can I afford to spend?”
It’s: “What exactly am I retiring to?”
Retirement changes two systems at once
For most of your working life, your schedule and your finances reinforced each other. Work determined where you needed to be and when you needed to be there. Meanwhile, your financial life largely ran in the opposite direction: earn money, pay the bills, save what you can and leave the investment accounts alone. There was structure around both your time and your money.
Retirement removes much of that structure at once.
Researchers who study the retirement transition have found that work provides more than income. It can provide daily structure, identity, social interaction and meaning.
When work disappears, retirees have to decide not only what they want the next stage of life to mean, but also what they are going to do on an ordinary Wednesday morning. Research examining retirees' use of time has similarly found that routines can help restore a sense of order and purpose after leaving work.
That matters financially, because money suddenly changes jobs too. For decades, the objective was accumulation. Now the portfolio is supposed to fund your life. And I have found in planning conversations that this transition can break in two very different directions.
Some people struggle to spend at all.
They have spent 30 or 40 years treating withdrawals from an investment account as something to avoid. A financial plan can show that a trip, a larger annual gifting budget or additional lifestyle spending is well within reach, yet every withdrawal still feels like moving backward.
Other people move in the opposite direction. They finally have the time to travel. The house project that sat on the list for years can finally get done. The vehicle is due for replacement.
The children and grandchildren are more accessible. There are more lunches out, more long weekends, and more opportunities to say, “Why not? This is what we worked for.”
None of those decisions is inherently a problem. The problem is when the retirement plan assumed one lifestyle and retirement produces another.
The first few years deserve special attention
This disconnect becomes particularly important early in retirement.
Retirement-income research has long recognized sequence-of-returns risk: when withdrawals occur during an unfavorable period of market returns, particularly earlier in a retirement distribution period, the combination of portfolio losses and withdrawals can make recovery more difficult.
Research published in the Journal of Financial Planning has therefore emphasized evaluating withdrawal rates alongside changing portfolio conditions rather than assuming a distribution plan should run indefinitely on autopilot.
This does not mean retirees should be afraid to spend during their first few years. It means the first years should be intentional.
When I build retirement income plans with clients, I do not want to know only what their portfolio can theoretically distribute over 30 years. I want to understand what those distributions are actually expected to fund:
Which expenses are part of the recurring lifestyle, and which are discretionary?
Which large expenses are likely to occur only once?
And how much cash should be available so a client is not forced to sell investments simply because the market happens to be down when a major expense arrives?
Those distinctions matter because a $250,000 lifestyle composed almost entirely of recurring commitments is very different from a $250,000 lifestyle that includes $70,000 of travel, home projects and other expenses that could be adjusted temporarily.
The annual spending number may look identical. The retirement plan is not.
Consider what happens when it doesn't
How so? Well, imagine a recently retired executive who spent years counting down to retirement.
Financially, he prepared well.
He accumulated enough assets.
His advisor modeled his retirement income, coordinated Social Security with portfolio withdrawals, and established cash reserves. And the probability of the plan succeeding looked strong.
He was ready to retire financially.
But he had spent far less time designing retirement itself.
So, Monday morning arrives.
He still wakes up at six.
But by ten, he’s restless.
There are no meetings.
Nobody needs an answer from him.
The phone barely rings.
Now, at first, the freedom feels good.
Then he starts creating things to do. There is a truck he has been thinking about replacing, and now seems like the time. The kitchen could use an update. His spouse mentions a trip they have talked about for years, so they book it. Then another one, because the calendar still looks surprisingly empty.
Individually, none of those decisions breaks the plan.
Together, however, they produce a very different first two years of retirement from the ones the financial plan modeled. This is a composite example, but it reflects something that comes up repeatedly in real planning work: the assumptions inside a retirement model are only useful if they bear some resemblance to how the client intends to live.
That is why the more useful conversation is not, “Can I afford to spend $250,000 a year?”
It’s: Here is the lifestyle we want to maintain.
Here are the experiences we want retirement to include.
Here are the major expenses we expect during the next five years.
And here is how the portfolio will fund them without allowing a few unusually expensive years to dictate the rest of the plan.
The opposite problem matters just as much
There is another version of the empty Monday, and it gets far less attention.
For example, picture a couple who prepared every bit as carefully.
The same solid plan, the same reserves, the same strong probability of success. But when the calendar empties, they respond with caution instead of consumption.
The trip they have discussed for years can wait until they are sure.
The home project can wait.
They would like to help a grandchild, but perhaps next year, just to be safe.
And they watch the account balance rise and fall, and quietly decide not to touch it.
The portfolio keeps growing while their willingness to use it gradually shrinks. And the years when they had the health, the time and the interest to enjoy what they built slip past while they wait for a certainty that never quite arrives.
This is not necessarily better financial behavior.
David Blanchett, head of retirement research at Prudential, has documented that inflation-adjusted spending tends to decline as retirees age. He named the pattern the retirement "spending smile," and, for the typical retiree, a steadier "smirk."
Notably, he finds that decline is largely a matter of choice rather than hardship.
One implication is that a plan built on flat, inflation-adjusted spending can understate how much a retiree could comfortably spend early on. The early years, in other words, are the high-capacity years, and they do not come back.
So sometimes the planning work is not convincing someone to save another dollar. It is helping them understand that the plan already allows them to use the money they spent decades accumulating. That requires a different kind of guardrail: not a maximum they should not exceed, but permission to fund something the plan was built to support.
Overspending and underspending look opposite, but the underlying problem is surprisingly similar.
The money lacks a job because the time lacks a plan.
Build the week before you build the withdrawal
This is why retirement preparation should begin before the retirement date, and not simply by determining an asset allocation or deciding when to claim Social Security.
Start by designing an ordinary week.
Ask: Where will you be on Monday morning?
Which relationships will receive more of your time?
Will you travel frequently or prefer longer periods at home?
Is there volunteer work, a part-time role or consulting you want to keep?
Will exercise, hobbies, learning, faith or community have recurring places on the calendar?
And, perhaps most importantly: What does that life cost?
Now the financial plan has something tangible to fund. Travel and family support can carry their own budgets. Major home projects can be modeled separately from recurring lifestyle spending. Cash reserves can be established around the actual distribution needs. And the portfolio can be managed according to a withdrawal process rather than whatever happens to feel right when the market, or the retiree's emotions, changes.
That is the difference between a retirement projection and a retirement income plan. A projection tells you whether the numbers might work. A retirement income plan connects those numbers to the life you intend to live.
Give freedom some form
For years, retirement planning has centered on a number: “How much do I need?”
Sure, that matters.
But eventually the more useful question becomes what all of this money is supposed to make possible.
Retirement gives you something your career rarely did: control over an enormous amount of your own time.
But freedom without form can get heavy. For some people, that emptiness gets expensive. For others, it turns into hesitation, and the money they accumulated becomes something they are afraid to use. Neither outcome is what decades of saving were supposed to accomplish.
So, build the rhythm for your week before you need it. Identify the people, activities and experiences that deserve space on the calendar. Separate the lifestyle you intend to maintain from the purchases and experiences that will come and go. Then build the withdrawal strategy around that life, because a retirement income plan is only as good as the life it is funding.
Give your days a shape, and your money finally has somewhere to go.
Sources
Journal of Financial Planning, "Probability-of-Failure-Based Decision Rules to Manage Sequence Risk in Retirement": https://www.financialplanningassociation.org/article/journal/NOV11-probability-failure-based-decision-rules-manage-sequence-risk-retirement
Journal of Financial Planning, "The Impact of Guaranteed Income and Dynamic Withdrawals on Safe Initial Withdrawal Rates": https://www.financialplanningassociation.org/article/journal/APR17-impact-guaranteed-income-and-dynamic-withdrawals-safe-initial-withdrawal-rates
The Gerontologist, "The Role of Meaning in the Retirement Transition: Scoping Review":
https://pubmed.ncbi.nlm.nih.gov/39969022/
Ageing & Society, "The Task of Time in Retirement":
https://www.cambridge.org/core/journals/ageing-and-society/article/task-of-time-in-retirement/8193FE7C3D8DA60C2086E2B4EE1D98DA
Financial Planning Review, David Blanchett, "How Spending Evolves in Retirement: A Smile, a Smirk, or Something Else?": https://onlinelibrary.wiley.com/doi/10.1002/cfp2.70032
Journal of Organizational Behavior, "Retiring: Role Identity Processes in Retirement Transition":
https://onlinelibrary.wiley.com/doi/10.1002/job.2438

Weekly Market Update: Oil and Yields Pressure Markets Ahead of the Fed
Markets traded lower this week as rising oil prices and long-term interest rates weighed on risk assets.
The S&P 500 fell 2.0%, the Nasdaq declined 1.2%, and the Russell 2000 small-cap index returned -2.6%. Growth (-1.7%) outperformed Value (-2.4%), while the Equal-Weight S&P 500 fell 3.1%, signaling broad weakness beneath the major indexes.
Energy (+0.7%) was the only sector to finish higher, while Technology was nearly flat. Health Care (-4.3%), Consumer Discretionary (-3.9%), and Materials (-3.6%) led to the downside.
Bonds declined as Treasury yields rose, with long-maturity Treasuries falling 1.7% and the 10-year yield approaching 5%. Corporate bonds also declined but outperformed Treasuries. Oil surged 12.5%, volatility increased, the U.S. dollar was little changed, and Bitcoin fell nearly 6% after a 20% rally.

Key Takeaways
Labor Conditions Improved in August After Several Weak Months of Hiring
Employers added 162,000 jobs, while the unemployment rate held at 4.1%. Prior months also looked better after revisions: June payroll growth was raised to +31,000 from +20,000, and July was revised from an initially reported -23,000 jobs to +21,000. Combined, the revisions added 55,000 jobs to the previous two months. The report does not suggest the labor market has returned to the strength of earlier years, but it paints a less concerning picture than investors saw after July's initial release.
Why it matters: The labor market still appears to be cooling, but August suggests that deterioration is occurring more gradually than previously feared.
Middle East Conflict is Becoming Harder for Markets to Treat as a Temporary Disruption
Oil prices moved sharply higher as fighting intensified and disruptions to energy shipments through the Strait of Hormuz continued. U.S. crude moved back above $100 per barrel after falling substantially earlier in the summer. More importantly, repeated escalations are making it harder to assume that each increase in energy prices will quickly unwind.
Why it matters: The longer the disruption persists, the more relevant energy becomes as an ongoing source of inflation uncertainty rather than a series of isolated weekly price swings.
Long-Term Borrowing Costs Continue to Rise Across Global Bond Markets
The 10-year Treasury yield climbed above 4.90% this week, its highest level since October 2023, while the 30-year moved above 5.3%. Government-bond yields also rose across several major developed markets as investors weighed inflation, higher energy costs, government borrowing needs, and tighter monetary policy. The breadth of the move suggests that higher long-term rates are not simply a reaction to one U.S. economic report or a shift in Fed expectations.
Why it matters: A wider set of global forces is putting upward pressure on long-term borrowing costs, making it harder to attribute elevated yields to any single economic report or shift in central-bank policy.
Expectations for a Rate Hike at Next Week's Fed Meeting Continue to Build
The Fed held rates at 3.50% to 3.75% in July, although three policymakers preferred a 0.25% hike. At Jackson Hole, Chair Warsh described the labor market as stable and said inflation should remain the Fed's predominant focus. Since then, stronger August job growth, higher oil prices, and renewed producer-price pressure have strengthened the case for an increase. Futures markets now place roughly a 70% probability on a +0.25% move at the September 15 to 16 meeting.
Why it matters: Next week's decision will show whether firmer labor data and persistent inflation pressure have been enough to move the Fed from considering a rate hike to delivering one.
AI Infrastructure Spending Remains Resilient Despite Volatile Macro Backdrop
Oil prices and long-term yields have risen, inflation pressure has increased, and the market expects a Fed hike. Those shifts would normally make large capital projects more expensive and could lead companies to reconsider spending plans. So far, however, the largest tech companies have continued committing substantial capital to data centers, computing capacity, and other AI infrastructure.
Why it matters: AI investment has become a significant contributor to both economic growth and corporate earnings, and so far, the largest tech companies appear willing to continue that spending despite volatility in rates, energy prices, and inflation.

The Withdrawal Order You Were Taught Can Quietly Cost You
There's a standard rule for which accounts you should spend first in retirement.
Spend the taxable brokerage account first. Then move to the traditional IRA or 401(k). Save the Roth for last.
There's logic behind that advice. Spending taxable assets first can allow your tax-deferred and tax-free accounts to continue compounding. It can also keep your taxable income relatively low in the first few years of retirement.
The problem is that retirement taxes aren't calculated one year at a time.
Follow that withdrawal order on autopilot, and you may spend years congratulating yourself for keeping your tax bill low while quietly building a much larger one for later.
That's because every dollar left growing inside a traditional IRA isn't simply money you've deferred paying tax on. It's also future taxable income that, eventually, you may no longer control the timing of.
And that changes the question you should be asking.
The question isn't:
Which account should I spend first?
It's:
Which account should fund the next dollar of spending this year, given what that decision may do to my taxes over the rest of my retirement?
That's a very different problem.
The Default Rule Solves for This Year's Tax Bill
The traditional withdrawal hierarchy exists for a good reason.
Suppose you retire with money spread among a taxable brokerage account, a traditional IRA and a Roth IRA. If you can meet your spending needs from the brokerage account without realizing much taxable income, your tax return may look remarkably clean.
Your traditional IRA continues growing tax-deferred.
Your Roth continues growing tax-free.
And your current tax bill stays relatively low.
Viewed one year at a time, that can look like smart tax planning.
Viewed over 20 or 30 years, it may not be.
Traditional IRA money eventually becomes subject to required minimum distributions. Under current law, the applicable RMD age is generally 73 for those born between 1951 and 1959, and 75 for those born in 1960 or later. Once RMDs begin, an IRS formula sets a minimum amount that has to come out each year.
That means a retiree who spends aggressively from taxable assets while leaving a large traditional IRA untouched can unintentionally concentrate more and more of your future wealth inside the one account that eventually forces taxable income onto your return.
The mistake isn't tax deferral itself.
The mistake is assuming that more deferral is always better.
Sometimes Paying Tax Earlier Is the Tax-Saving Move
This is where retirement income planning gets counterintuitive.
For many higher-net-worth retirees, some of the most valuable tax-planning years arrive right after they stop working. The paycheck stops, bonuses and business income fade, Social Security may not have started yet, and required distributions haven't begun. Someone who spent decades in relatively high brackets can suddenly have several years in which surprisingly little ordinary income lands on the return.
I think of these as tax-planning windows, and I don't want to waste one simply because a retiree has enough sitting in a brokerage account to leave the IRA untouched. I wrote about this window in more depth in The Retirement Tax Window Most People Miss.
So this is one of the first places I look when building a retirement income strategy. We map the income already expected each year, pensions, Social Security, interest, dividends, capital gains and the rest, and then look at how much room remains inside the brackets we're willing to use.
That may lead us to intentionally recognize additional IRA income. Sometimes that means taking a traditional IRA distribution and actually spending the money. Other times it means converting part of the traditional IRA to Roth and funding lifestyle spending elsewhere. A Roth conversion generally causes previously untaxed traditional IRA dollars to be included in taxable income in the year of the conversion.
Either way, the objective is the same:
Pay tax on some of the IRA when you choose the timing, instead of waiting until the tax code chooses it for you.
Academic research on retirement withdrawals supports this approach. James DiLellio and Daniel Ostrov examined individualized withdrawal strategies across taxable, tax-deferred and Roth accounts and found that sequencing can materially affect portfolio outcomes, arguing specifically against relying on simple chronological withdrawal rules when tax brackets, RMDs and other variables change over time.
More recent work from Stanford goes one step further: these decisions should be recalculated as circumstances change rather than solved once at retirement, with the strategy updated each year based on current balances, taxes, investment outcomes and inflation. That's much closer to how I believe retirement income planning should actually work.
The Withdrawal Order Should Change From Year to Year
This is why I rarely think of retirement withdrawals as a fixed hierarchy.
I think of them as an annual coordination problem.
In a relatively low-income year, we may intentionally create taxable income from an IRA.
In another year, a large capital gain, pension payment, business transaction or other income event may already have filled the brackets we want to use. In that case, taxable assets or Roth dollars might make more sense for additional spending.
Once Social Security begins, we have another variable to coordinate.
Once Medicare begins, there's another.
Once RMDs begin, there's another.
The answer can change again after the death of a spouse, when the surviving spouse may eventually be filing under narrower single-filer tax brackets.
There's no account that's universally "first."
There's only the account that makes the most sense given the rest of that year's financial plan.
Consider Two Retirees With the Same $2 Million
Imagine two recently retired households.
Each starts retirement with $2 million.
Each has the same amount in taxable investments, traditional retirement accounts and Roth accounts.
Each spends the same amount.
Their investments earn the same returns.
The difference is how they decide where the spending money comes from.
Retiree One: Follow the textbook order
The first household follows the conventional rule.
The brokerage account comes first.
They sell investments as needed to fund retirement and leave the traditional IRA alone for as long as possible.
Their tax returns initially look terrific.
With no paycheck and relatively little ordinary income, they may spend several years in unusually low brackets.
But they aren't actually using those brackets for much of anything.
Meanwhile, the traditional IRA keeps compounding.
Eventually Social Security begins. Later, required minimum distributions begin.
Now the retiree has Social Security income, portfolio income and IRA distributions arriving on the same tax return.
And the IRA distribution is no longer entirely optional.
Retiree Two: Use the low-income years deliberately
The second household also uses the brokerage account for spending.
But each year, they look beyond the current tax bill.
While their taxable income is temporarily low, they intentionally take some money from the traditional IRA or convert part of it to Roth.
They may pay more tax in their 60s than the first retiree.
That's intentional.
Because they aren't trying to minimize taxes this year.
They're trying to manage taxes across retirement.
By the time required distributions begin, the second household has a smaller traditional IRA balance and more money sitting in accounts that provide greater flexibility.
Same starting wealth.
Same lifestyle.
Same investment environment.
Different tax path.
And potentially a materially different amount of wealth available over their lifetime.
The point isn't that Roth conversions automatically save taxes. They don't. Converting too much, converting at the wrong tax rate or ignoring other parts of the tax return can make a conversion counterproductive.
The point is that withdrawal sequencing changes the timing and rate at which your retirement wealth gets taxed, and that timing can matter substantially.
Medicare Adds Another Threshold to Watch
Tax brackets aren't the only line I watch. Medicare premiums move with income too.
Higher-income Medicare beneficiaries pay income-related surcharges, known as IRMAA, on Medicare Part B and Part D. Those surcharges generally use modified adjusted gross income from the tax return two years earlier. So a Roth conversion might lower future RMDs and raise a Medicare premium two years later.
That doesn't mean you should avoid the conversion. It means the IRMAA cost needs to be part of the calculation.
I raise this because retirement tax decisions often get reduced to a single rule: "Don't cross the next tax bracket," or "Don't trigger IRMAA." Neither is a complete strategy. I'd willingly cross a threshold today if the long-term math favored it, and I wouldn't convert an extra dollar simply because there's technically room left in a bracket. The goal isn't to fill brackets for the sake of filling brackets. It's to understand what today's marginal dollar of taxable income may save, or cost, you later.
Long-Term Map, Annual Decision
When I work through this decision with clients, I don't want to look only at this year's tax return. And I don't want to rely solely on a 30-year retirement projection either. You need both.
First, we build the longer-term retirement income map: when employment income stops, when Social Security might begin, what pension income exists, how large the tax-deferred accounts could become and when required distributions are likely to enter the picture. That helps identify where the potential tax-planning windows exist. I walk through building that map in The Tax Cost of Retiring Without a Retirement Income Map.
Then we bring the decision back to the current year. How much ordinary income is already on the return? How much capital gain are we recognizing? What deductions are available? Are we approaching a Medicare threshold? Is there charitable giving to coordinate? What's changed since the long-term projection was built?
That annual review matters because a 20-year tax projection isn't a promise. Tax laws change. Markets change. Income, spending and the portfolio all change. So should the withdrawal strategy.
That's why I don't think the right question is, "What's my retirement withdrawal order?" The better question is:
What should my withdrawal order be this year?
The Coordination Is the Plan
The textbook withdrawal order, taxable, then tax-deferred, then Roth, is useful as a starting point. It isn't a retirement income strategy.
The retirees who have the greatest flexibility are often the ones who recognize that every account represents a different future tax choice. A taxable account gives you one set of choices. A traditional IRA gives you another. A Roth gives you another. Which assets you hold inside each is a related decision, one I cover in Asset Location: The Retirement Tax Mistake Hiding in Plain Sight.
The goal isn't to empty those accounts in some predetermined sequence. It's to coordinate them so that you can fund the life you want while controlling when and how much taxable income shows up along the way.
That may mean deliberately paying more tax in certain years. It may mean leaving a tax bracket partially unused in another. It may mean converting IRA dollars before Social Security begins, or using Roth assets during an unusually high-income year. And it means revisiting the decision every year rather than setting the withdrawal order on the day you retire and never looking at it again.
The standard withdrawal order is a default, not a decision.
Decide the order while you still have the ability to choose.
Because once required distributions begin, part of that choice has already been made for you.
Sources
Internal Revenue Service, Retirement Plan and IRA Required Minimum Distribution FAQs:
https://www.irs.gov/retirement-plans/retirement-plan-and-ira-required-minimum-distributions-faqs
Internal Revenue Service, Retirement Plans FAQs Regarding IRAs (including Roth conversions):
https://www.irs.gov/retirement-plans/retirement-plans-faqs-regarding-iras
Social Security Administration, Medicare Premiums and income-related adjustments:
https://www.ssa.gov/benefits/medicare/medicare-premiums.html
Centers for Medicare & Medicaid Services, 2026 Medicare Parts A & B Premiums and Deductibles fact sheet:
https://www.cms.gov/newsroom/fact-sheets/2026-medicare-parts-b-premiums-deductibles
DiLellio, James, and Daniel Ostrov, "Toward Constructing Tax Efficient Withdrawal Strategies for Retirees with Traditional 401(k)/IRAs, Roth 401(k)/IRAs, and Taxable Accounts" Financial Services Review
https://openjournals.libs.uga.edu/fsr/article/view/3419
Johansson, Kasper, and Stephen Boyd, "A Tax-Efficient Model Predictive Control Policy for Retirement Funding," Journal of Retirement
https://web.stanford.edu/~boyd/papers/retirement.html

Monthly Market Update: Stocks Set Broad Records as Rates Climb
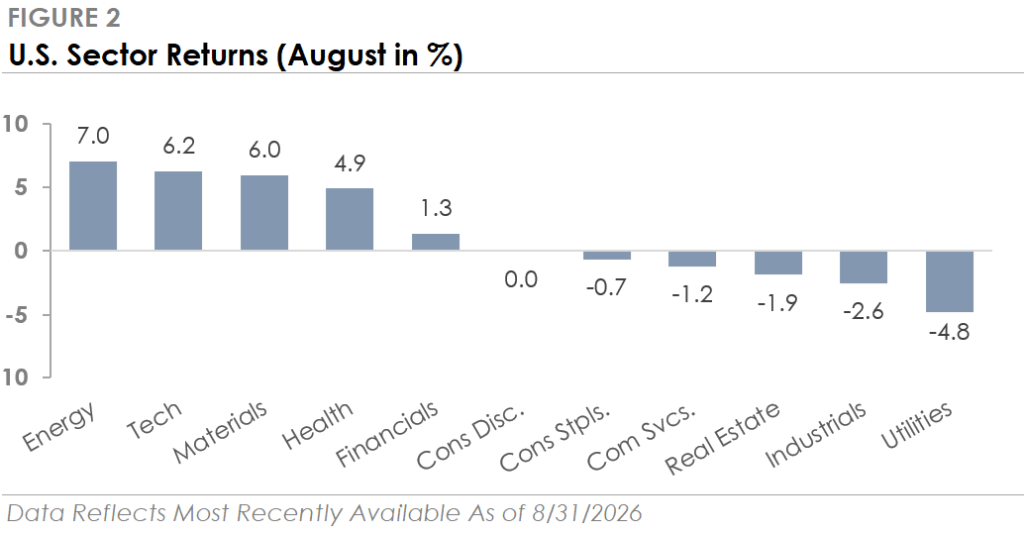
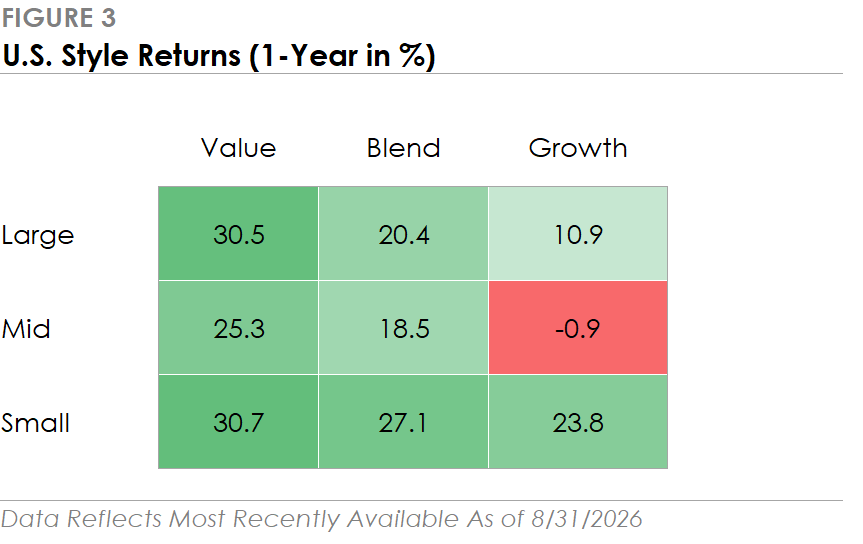
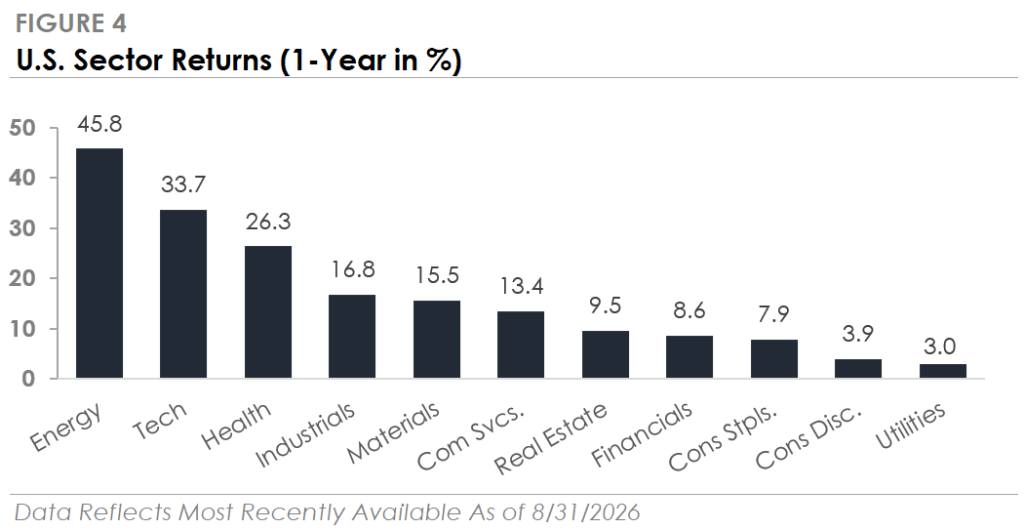
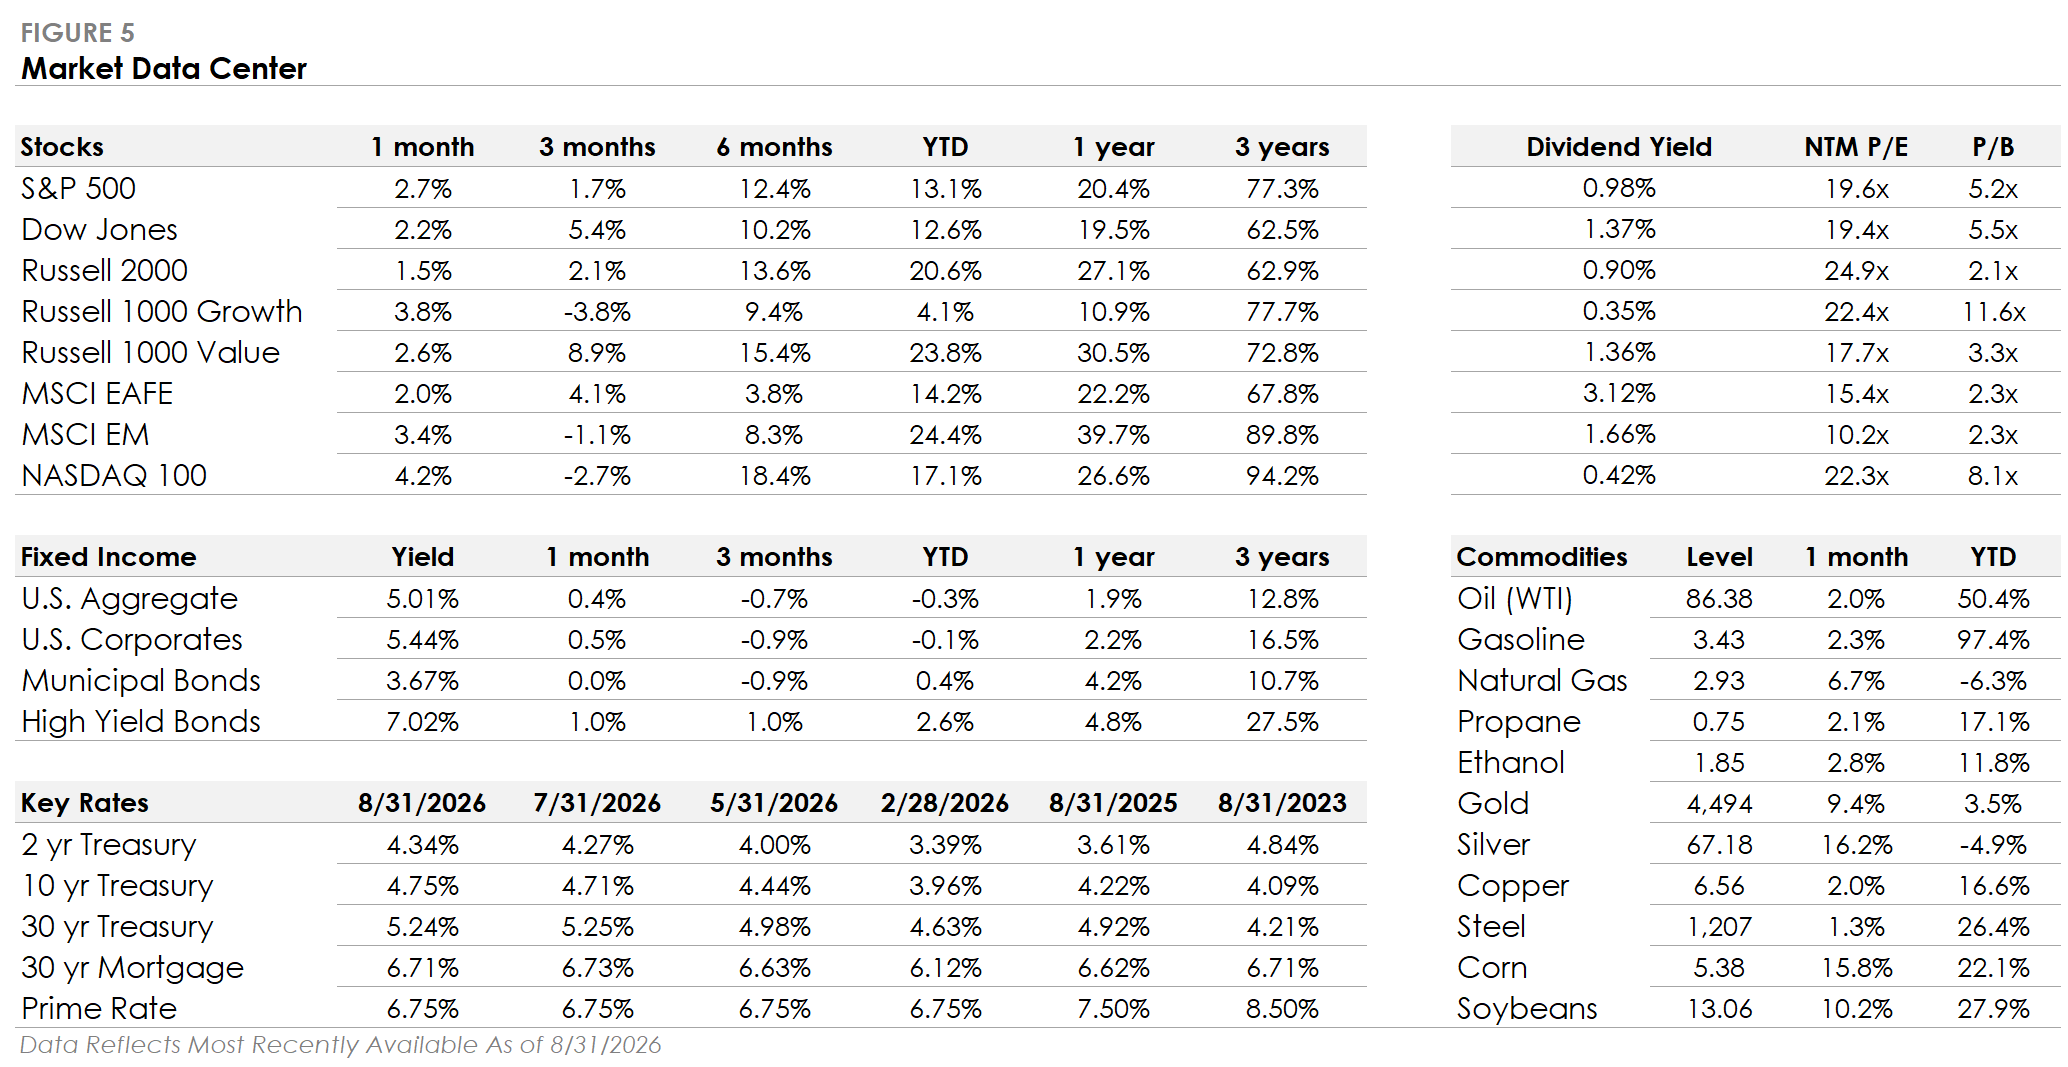
The S&P 500 Index returned +2.7% in August and set a new high. Five of the eleven S&P 500 sectors traded higher, with four outperforming the broad index. Energy (+7.0%) led all sectors, followed by Technology (+6.2%) as the sector rebounded from a July selloff and Materials (+6.0%) as gold gained nearly 10%. Utilities (-4.8%) led to the downside, followed by Industrials (-2.6%) and Real Estate (-1.9%).
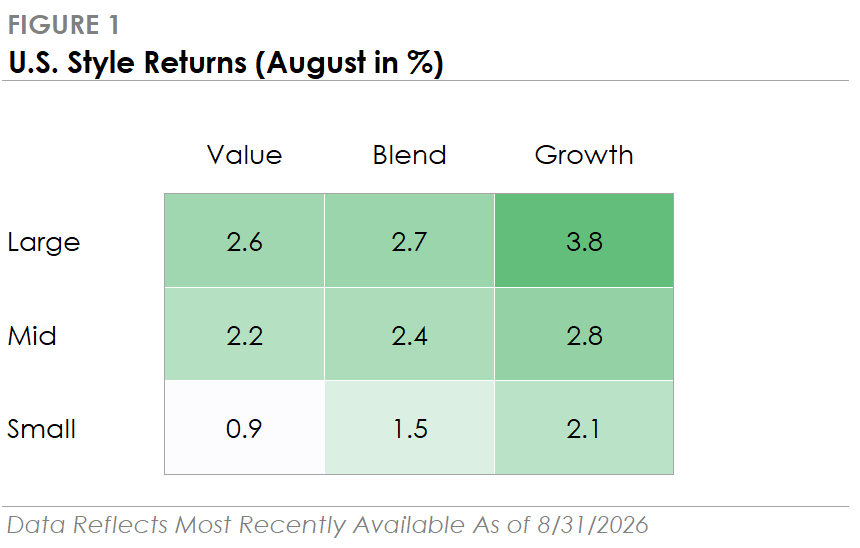
Bonds traded higher despite Treasury yields rising throughout the month, with the U.S. Bond Aggregate returning +0.4%. Investment-grade corporate bonds modestly outperformed with a +0.5% total return, while high-yield gained 1.0%.
International stocks traded higher in August. Developed markets gained 2.0% and underperformed the S&P 500, while emerging markets returned +3.4% and outperformed as international tech stocks rebounded alongside U.S. tech stocks.
Stocks Set New Highs as Rates Climb
Equity markets traded higher in August, with strength extending across most broad stock market indexes. The S&P 500, Dow Jones, Russell 2000, and equal-weight S&P 500 all set new all-time highs during the month, and the Nasdaq 100 approached its June high.
The breadth of records was notable because the indexes capture very different parts of the market, from mega-cap tech to small-caps and the average S&P 500 company.
Market leadership has shifted multiple times this year, alternating between broad participation and concentration. August looked different, with strength spread across a wide range of companies and equity market segments.
The bond market offered a counterpoint to the strength in stocks. Treasury yields faced broad upward pressure during August, with the 10-year yield climbing above 4.75%, the highest since January 2025, and the 30-year approaching 5.30%, its highest level since 2007.
The rise in longer-term yields reflected several concerns, including persistent inflation, elevated government borrowing, and renewed uncertainty around energy prices.
Near the end of the month, Fed Chair Kevin Warsh's Jackson Hole speech signaled that the Fed's next move could be a rate hike rather than a rate cut, which added further upward pressure on Treasury yields. Despite the rate volatility, corporate credit spreads remained relatively calm and sit near record lows, suggesting investors are more concerned about the path of interest rates than companies' ability to repay their debt.
Markets Learn to Live with Headline Volatility
Geopolitics have dominated headlines this year, but their impact has changed as the year progresses. Oil prices continue to move when Middle East developments alter the outlook for global energy supply.
The difference is that investors appear less willing to treat each new headline as an economic shock. Earlier this year, the start of the conflict and disruption in the Strait of Hormuz caused oil prices to surge and contributed to a broad stock market selloff. Since then, investors have experienced several rounds of escalation and de-escalation.
Oil still jumps on new developments, but markets are increasingly waiting for evidence that a headline will affect energy supply, inflation, and economic growth before reacting as dramatically as they did in March.
Artificial intelligence is the second dominant market theme. Investors continue to debate whether the large sums being spent on data centers, computer chips, power generation, and networking equipment will ultimately generate adequate returns, but the companies making those investments keep moving ahead.
Nvidia's earnings report provided another indication that demand for AI infrastructure remains strong, with quarterly revenue more than doubling from a year ago. Spending plans across the industry keep rising as companies race to add computing capacity and build the infrastructure needed to support AI.
There are still questions about the eventual return on the hundreds of billions being spent, but the debate in financial markets has done little to slow the companies making the investments.

The Return You're Chasing Already Happened
There's a particular kind of investment decision that rarely feels reckless in the moment.
A part of the market has had an exceptional run. The companies are strong. The narrative makes sense. Every time you open your account, those positions seem to be doing exactly what you hoped they would.
So you add more.
That doesn't necessarily feel like chasing returns. It can feel prudent. Why put new money into investments that have lagged when the winners seem to be proving themselves month after month?
The problem is that your brain may be answering a different question than the one your portfolio needs you to answer.
Instead of asking, What mix of investments gives me the appropriate amount of risk for where I'm trying to go? you begin asking, What's been working lately?
That's where recency bias can quietly take control of a portfolio.
And for successful investors, particularly technology executives whose careers, compensation, and accumulated wealth may already be connected to the same companies or sector, the bigger risk isn't simply choosing the wrong investment next.
It's allowing yesterday's returns to determine how much risk you take tomorrow.
What Just Happened Feels Like What Happens Next
One of the central problems in investing is that our expectations aren't formed in a vacuum.
What we've recently experienced matters.
Robin Greenwood and Andrei Shleifer examined six different measures of investor expectations covering nearly five decades. They found that expectations for future stock returns were strongly tied to past market returns and to how high the market had already climbed.
In plain English, after stocks performed well, investors tended to expect more of the same.
But there was another important finding: those expectations were strongly negatively related to the returns the models actually projected going forward. The periods that left investors feeling more and more optimistic weren't necessarily the periods when future returns looked attractive.
A strong return is evidence of what's happened.
It's not evidence of what must happen next.
Research by Ulrike Malmendier and Stefan Nagel adds another piece of the puzzle. Studying household investing with Survey of Consumer Finances data from 1960 through 2007, they found that people's own experiences with stock and bond returns shaped how much risk they were willing to take and how they allocated their portfolios. More recent experiences carried greater weight.
Our memories, in other words, can become inputs into our portfolios.
And the freshest memories can become some of the most influential.
The Return That Convinced You Is the Return You Already Missed
This tendency shows up in what investors actually do with their money.
Erik Sirri and Peter Tufano studied money flowing into and out of equity mutual funds and found that investors based their buying decisions heavily on past performance. The relationship was particularly strong among the best-performing funds: exceptional prior performance pulled in a disproportionate share of new money.
That makes intuitive sense.
The investment with the best story is often the investment whose performance has already supplied the evidence for that story.
None of this means that last year's winner must become next year's loser.
A technology company can have an extraordinary year and keep performing well. An expensive asset can become more expensive. Market leadership can last much longer than investors expect.
That's why the lesson isn't to bet against whatever has recently performed well.
The lesson is simpler:
The return that convinced you to buy is a return that's already occurred.
Your decision today needs to be justified by what the investment contributes to your portfolio from this point forward.
How Concentration Actually Shows Up
This issue is usually more subtle in practice than an investor deliberately deciding to make a giant bet on last year's winner.
In one recent planning engagement, we worked with an executive whose compensation included salary, bonus, and recurring restricted stock units.
Those RSUs were an important part of the family's wealth-building engine. At the same time, the taxable portfolio was being built to serve an entirely different purpose: helping create enough financial flexibility for the executive to eventually step away from a high-paying career and move toward work optionality.
That distinction mattered.
Each time another block of RSUs vested, there were effectively two choices.
The first was passive: simply allow the employer shares to accumulate.
The second was deliberate: treat the vest as a new capital-allocation decision and ask where those dollars belonged given the family's overall portfolio, future spending needs, and risk capacity.
We chose the second approach.
The planning process called for vested equity to help fund a diversified taxable portfolio rather than allowing employer stock exposure to compound indefinitely by default. That taxable portfolio was spread across multiple asset classes and placed on a quarterly rebalancing schedule.
The important part wasn't predicting whether the employer's stock would outperform.
We didn't need to.
The issue was that the client's salary, future compensation, and a growing portion of financial wealth could otherwise become increasingly dependent on the same company.
And a position can become concentrated without the investor ever consciously deciding, I want more concentration.
Imagine that a $500,000 employer-stock position rises to $750,000.
Nothing was purchased.
No investment decision was made.
But the risk exposure changed materially.
Then another RSU grant vests.
Keeping those shares may feel innocuous because the stock has performed well, and because familiarity with the company can make the investment feel easier to understand than something outside the investor's immediate experience.
Another vest arrives six months later.
Then another.
Over time, what began as compensation can quietly become an investment thesis.
That's the practical danger of recency bias for investors with equity compensation. The bias doesn't always tell you to go out and buy the hottest stock.
Sometimes it simply tells you there's no reason to disturb what's already been working.
Success Can Change the Portfolio Without Your Permission
Now extend that problem across the rest of a high-income household's balance sheet.
The executive owns employer shares.
The 401(k) contains a large-cap U.S. index.
The taxable account owns another broad-market strategy.
Perhaps there are additional technology holdings accumulated over the years.
Viewed separately, none of those investments may appear particularly alarming.
Viewed together, however, they may represent substantially more exposure to the same companies, sector, and economic forces than the investor realizes.
This is particularly important for technology professionals.
Your human capital may already depend on the technology industry.
Your bonus may depend on company performance.
Your future RSU value depends on the employer's stock.
Your existing shares may represent a substantial portion of your financial capital.
And broad-market indexes can add further exposure to some of the same companies that have already driven your wealth higher.
The question, then, isn't simply, Is this a good company?
It may be an exceptional company.
The better portfolio question is:
How much of my financial future should depend on it?
Lisa Meulbroek's research into company stock held by employees illustrates the economic problem created by combining employment exposure with concentrated ownership of employer shares. Even when an employee believes strongly in the company, concentrated employer stock exposes the household to risks that could otherwise be diversified.
That distinction matters because diversification isn't a judgment about whether your company will succeed.
It's a judgment about how much of your family's future should depend on being right about any single outcome.
Why Portfolio Discipline Sometimes Feels Wrong
This is where a disciplined investment process earns its keep.
You establish what role each asset is supposed to play.
You decide how much concentration you're willing to accept.
You determine an appropriate allocation based on the return you need, the risk you can afford to take, your liquidity requirements, taxes, time horizon, and the goals the portfolio ultimately needs to fund.
Then you periodically compare the portfolio you actually own with the portfolio you intended to own.
That last step matters because successful investments don't remain politely inside their original allocations.
They grow.
For an investor receiving equity compensation, there's another layer: new shares may keep arriving even after an existing position has already become large.
That means maintaining the portfolio may require an active process for deciding what happens when shares vest.
Hold?
Sell?
Diversify?
Fund another goal?
The answer will vary by investor. Taxes, trading restrictions, holding periods, liquidity needs, charitable objectives, and the rest of the financial plan all matter.
What shouldn't determine the answer by itself is the fact that the stock has recently gone up.
Sometimes the most important portfolio decision isn't identifying the next winner.
It's recognizing how much your previous winners have already changed your risk exposure.
Don't Ask Your Memory to Vote
The solution to recency bias isn't becoming better at predicting which sector will lead next.
It isn't selling everything that's performed well.
And it certainly isn't reflexively buying whatever performed poorly.
Those approaches simply replace one forecast with another.
The better defense is an investment process that doesn't require you to reconstruct your portfolio strategy every time the market hands you a new reason to feel optimistic or pessimistic.
Build the portfolio around your objectives and risk profile.
Understand your exposure across all of your accounts.
Include employer stock and future equity compensation when evaluating concentration.
Establish parameters for how much risk you're willing to allow any one company, sector, or economic driver to contribute.
And when equity compensation vests, treat those shares as a fresh allocation decision rather than automatically assuming yesterday's allocation should become tomorrow's.
Then periodically compare the portfolio you actually own with the one you deliberately set out to build.
That leads to one useful question to ask this quarter:
Have my recent winners quietly made me more concentrated than I ever consciously chose to be?
If the answer is yes, that doesn't automatically mean those investments should be sold.
Taxes matter. Equity-compensation restrictions matter. Liquidity needs matter. Your broader financial plan matters.
But it does mean the portfolio deserves another look.
Because the job of an investment strategy isn't to own whatever just worked.
It's to maintain the amount and type of risk necessary to get you where you're trying to go, even when the rearview mirror is telling you to do something else.
Sources
Greenwood, Robin, and Andrei Shleifer. "Expectations of Returns and Expected Returns." The Review of Financial Studies, 2014.
https://academic.oup.com/rfs/article-abstract/27/3/714/1580705
Malmendier, Ulrike, and Stefan Nagel. "Depression Babies: Do Macroeconomic Experiences Affect Risk Taking?" The Quarterly Journal of Economics, 2011.
https://academic.oup.com/qje/article-abstract/126/1/373/1901343
Sirri, Erik R., and Peter Tufano. "Costly Search and Mutual Fund Flows." The Journal of Finance, 1998.
https://onlinelibrary.wiley.com/doi/10.1111/0022-1082.00066
Meulbroek, Lisa. "Company Stock in Pension Plans: How Costly Is It?" The Journal of Law and Economics, 2005.
https://www.journals.uchicago.edu/doi/abs/10.1086/430807

The Roth Conversion Five-Year Rule That Can Cost You 10%
You did the smart thing.
You retired, your income dropped, and you used that opportunity to convert part of your traditional IRA to a Roth. You willingly paid the income tax today so that those dollars could potentially grow tax-free for the rest of your life.
Then, a couple of years later, you need some of the money.
You take a withdrawal from the Roth, assuming the logic is simple: I already paid tax on this money. It should be mine to use.
And then you discover that the IRS may want another 10%.
Not another income tax. A 10% additional tax for taking converted dollars out too soon.
That outcome feels especially counterintuitive because Roth conversion planning is often most attractive during the lower-income years immediately after retirement. Those are precisely the years when someone in their early or mid-50s may be trying to reduce a large pre-tax retirement balance before Social Security, required minimum distributions, or other income sources begin.
But there is an important catch.
Paying the tax on a Roth conversion changes the tax character of your money. It does not necessarily change when you can access it without penalty.
In other words, a Roth conversion changes your tax bill, not your timeline.
Why Converted Money Has Its Own Five-Year Clock
To understand the rule, it helps to understand why it exists.
Normally, someone who takes a taxable distribution from a traditional IRA before reaching age 59½ may owe ordinary income tax plus a 10% additional tax unless an exception applies. If that person could simply convert the traditional IRA to a Roth, pay the income tax on the conversion, and withdraw the converted dollars the next day without the additional tax, the conversion could become a side door around the early-distribution rules.
Congress specifically addressed that problem when the Roth rules were developed. The legislative history describes the conversion holding period as a way to prevent taxpayers from using a Roth conversion to receive premature retirement distributions while avoiding the early-withdrawal tax (House Conference Report 105-356).
That is where the five-year conversion rule comes in.
Under current IRS rules, each Roth conversion generally starts its own five-tax-year period. That period begins January 1 of the calendar year in which the conversion occurs, regardless of when during that year you actually complete the conversion. So a conversion completed in December 2026 is treated as beginning its five-year period on January 1, 2026.
If you are under age 59½ and withdraw converted dollars during that five-year period, the portion attributable to the amount that was taxable when converted may be subject to the 10% additional tax unless another statutory exception applies.
That last part matters. The penalty does not mean the converted amount becomes taxable income again. You already recognized the taxable portion when you completed the conversion. Instead, the rule effectively brings that previously taxed conversion amount back into the calculation for purposes of determining the 10% additional tax.
And if you complete conversions in multiple years, the clocks begin stacking.
Convert in 2026, and that conversion has one clock. Convert again in 2027, and that conversion gets another. Convert again in 2028, and now you have three separate conversion periods running at the same time.
The ordering rules make the sequence predictable. The IRS generally treats Roth IRA distributions as coming from regular contributions first, followed by conversions and rollovers on a first-in, first-out basis, and finally earnings. Within a particular conversion, the taxable portion is generally considered distributed before the nontaxable portion (see IRS Publication 590-B).
That ordering becomes particularly important if you are building what is commonly called a Roth conversion ladder.
There Are Really Three Roth Buckets
Part of the confusion around the Roth five-year rules comes from talking about a Roth IRA as though every dollar inside it works the same way.
It does not.
For distribution purposes, it helps to think about three different buckets.
Start with your regular Roth contributions. Your original direct Roth IRA contributions generally come out first under the ordering rules, and you can generally withdraw them without income tax or the 10% additional tax.
Next come your converted dollars. Conversion and rollover amounts come out after your regular contributions. Each conversion carries its own five-year period for the conversion-related 10% additional tax if you are under 59½, and that penalty generally applies only to the portion that was taxable when you converted.
Earnings come out last. Whether your earnings can be distributed tax-free depends on the separate rules for a qualified distribution, including whether the applicable Roth IRA five-year period has been satisfied and whether you have reached age 59½ or meet another qualifying condition.
That distinction is one of the most important parts of Roth planning because there is not simply one universal “Roth five-year rule.”
There is a conversion-specific five-year rule designed to determine whether the 10% additional tax can apply to converted principal withdrawn before age 59½. Separately, there is an account-level five-year requirement used to determine whether a Roth distribution, including earnings, is a qualified tax-free distribution.
Those rules often get blended together in casual explanations.
They should not be.
Age 59½ Changes the Conversion Rule
There is also an important off switch.
Once you reach age 59½, the conversion-specific 10% additional tax no longer applies merely because you are still inside a conversion's five-year period. Reaching age 59½ is one of the exceptions expressly identified by the IRS.
That means this particular trap matters most for people who retire early and begin Roth conversions in their 50s.
If you retire at 53, 55, or 57 and start converting a meaningful portion of a traditional IRA, liquidity planning becomes especially important. You may be deliberately recognizing income during a favorable planning window while simultaneously creating converted Roth dollars you do not want to rely on immediately for spending.
If you begin converting at 61 or 62, the conversion-specific early-distribution penalty is no longer the same concern because you have already crossed 59½. But the separate qualified-distribution rules can still matter, particularly when earnings are involved.
This is exactly why Roth conversions should not be done in isolation. The amount you convert is only one part of the decision. You also need to understand where your spending money will come from while those converted dollars are aging.
Consider a 55-Year-Old Early Retiree
Consider a hypothetical 55-year-old woman who recently retired after a successful career.
She has a sizable traditional IRA and expects her taxable income to be unusually low for the next several years. She sees that period as an opportunity to start reducing the amount of money that could eventually be exposed to required distributions later in retirement.
So she converts $80,000 from her traditional IRA to a Roth IRA.
Assume the full $80,000 is taxable as ordinary income. She pays the tax on the conversion that year, intentionally, because she believes shifting the money into a Roth will give her greater flexibility over the long run.
Two years later, her roof needs to be replaced.
The project costs $40,000.
She looks at the Roth account and thinks, I already paid tax on that money. Why not use it?
Assume for purposes of this example that she has no remaining regular Roth contribution basis ahead of the conversion under the IRS ordering rules, the $40,000 distribution is attributable entirely to the taxable portion of that recent conversion, and no exception to the early-distribution tax applies.
She takes out $40,000.
Because she is still under age 59½ and the conversion is still inside its five-year period, that $40,000 may be subject to a 10% additional tax.
That is $4,000.
She does not owe ordinary income tax on that same $40,000 again. The problem is the additional tax triggered by taking the converted money out too soon.
Now change one fact.
Suppose she waits until age 60 and takes the same $40,000 from that converted principal. She has crossed age 59½, so the conversion-related 10% additional tax no longer applies.
Or suppose she is still 57 but has enough regular Roth contribution basis available to cover the $40,000. Because regular contributions come out before conversion dollars under the ordering rules, that withdrawal could produce a very different result.
Or perhaps she pays for the roof from a taxable brokerage account instead. Selling investments there could create capital gains taxes depending on her basis and the investments sold, but it would not trigger the IRA's 10% early-distribution tax.
Same financial need. Different bucket. Different tax outcome.
The Roth conversion itself was not the problem. Touching the wrong dollars at the wrong time was.
A Conversion Plan Needs a Liquidity Plan
This is where Roth conversion planning starts to look less like a tax transaction and more like retirement income planning.
It is easy to focus entirely on the conversion calculation. How much room do I have in this tax bracket? How much should I convert this year? How might the conversion affect Medicare premiums later? How much could I reduce future required distributions?
Those are important questions. But there is another one that matters just as much: where will I get cash if something unexpected happens during the next five years?
If you are retiring before 59½ and planning several years of conversions, you may need a liquidity bridge alongside the conversion strategy. That could mean maintaining an appropriate cash reserve. It could mean deliberately preserving assets in a taxable brokerage account. It could mean knowing exactly how much regular Roth contribution basis you have available. It could mean sequencing conversions around known large purchases instead of automatically converting the maximum amount every year.
The point is not that converted Roth money can never be accessed early. There are exceptions to the 10% additional tax, and each taxpayer's facts matter.
The point is that you should not discover the distribution rules for the first time when the roof starts leaking.
The Five-Year Rule Is a Problem to Solve Before You Convert
A Roth conversion can be an incredibly useful planning tool.
It can help move retirement savings from an account where future distributions may be taxable into one where qualified future distributions may be tax-free. It can reduce future pre-tax balances, create greater flexibility over retirement income, and potentially improve how assets ultimately pass to heirs.
But none of those benefits mean every converted dollar should immediately be treated as available spending money.
That is why the five-year conversion rule is something to solve before you execute the conversion. Know which dollars live in which bucket. Know which five-year period applies. Know when age 59½ changes the rules. And most importantly, know where the next several years of spending will come from before deliberately moving money across the tax wall.
Because a Roth conversion changes your tax bill. It does not necessarily change your timeline.
And when conversions are part of a broader retirement strategy, that timeline should include more than projected tax brackets. It should include your actual life: the house, the travel, the family support, the unexpected expenses, and the cash you may need along the way.
If you are considering Roth conversions in your 50s, map your conversion schedule and your cash needs on the same timeline before you execute. That conversation often tells you far more than simply asking, how much should I convert this year? It is also how we help clients move through these decisions with clarity, confidence, and peace of mind.
Sources
Internal Revenue Service. Publication 590-B, Distributions from Individual Retirement Arrangements (IRAs).
https://www.irs.gov/publications/p590b
Internal Revenue Service. Instructions for Form 8606, Nondeductible IRAs.
https://www.irs.gov/instructions/i8606
Internal Revenue Service. Instructions for Form 5329, Additional Taxes on Qualified Plans (Including IRAs) and Other Tax-Favored Accounts.
https://www.irs.gov/instructions/i5329
U.S. Government Publishing Office. House Conference Report 105-356.
https://www.govinfo.gov/content/pkg/CRPT-105hrpt356/pdf/CRPT-105hrpt356.pdf
Weekly Market Update: Rising Rates Weigh on Stocks and Bonds
Markets moved lower this week as rising interest rates weighed on both stocks and bonds.
The S&P 500 declined 1.9%, the Nasdaq fell 3.1%, and the small-cap Russell 2000 lost 2.0%. Value stocks fell 0.6%, holding up far better than growth's 3.2% decline, as higher-valuation technology companies came under the most pressure.
The equal-weight S&P 500 declined a more modest 0.9%, a sign that weakness was concentrated among the market's largest companies.
At the sector level, energy gained nearly 5% and health care rose roughly 3%. Technology was the weakest performer, falling 4.2%, followed by industrials, down 3.3%.
Bonds also traded lower as Treasury yields moved higher. Longer-maturity Treasuries fell roughly 0.3%, and corporate bonds underperformed as credit spreads widened. Elsewhere, the U.S. dollar weakened 1.1%, the VIX moved modestly higher, and Bitcoin gained more than 14%.
Key Takeaways
Consumer Spending Softened in July
Retail and food-service sales fell 0.6% in July after rising just 0.2% in June. Unlike June, when much of the weakness was tied to gasoline, July's slowdown was broader, with sales excluding autos and gasoline down 0.2%.
Some of the softness may have reflected timing. Amazon's Prime Day fell in late June, potentially pulling online spending forward from July. Even so, the broader picture points to a consumer growing somewhat more cautious. That said, spending has not stopped: retail sales remained 5.0% above year-ago levels, and restaurants and several store categories continued to report gains.
Why it matters: The consumer remains an important source of support for the economy, but the past two months suggest spending momentum is moderating. That bears watching, because a meaningful slowdown in consumer activity could eventually weigh on economic growth.
Inflation Fears Weigh on Consumer Sentiment
Consumer sentiment weakened again in early August. The University of Michigan's index fell to 51.0 from 55.2 in July, reversing two consecutive months of improvement.
Inflation remains the key concern. Only 8% of consumers surveyed expected their income growth to outpace inflation over the next year, down from 18% in December. Higher prices, including energy costs, continue to pressure household purchasing power. Sentiment and spending do not always move together, and households can stay pessimistic while continuing to spend, but persistent concern about purchasing power raises the risk that they eventually pull back.
Why it matters: Consumers are still spending, but confidence is weakening. If households begin acting on those concerns by cutting back, it could become another headwind for economic growth.
Rising Oil Prices Complicate the Fed's Path
Oil prices moved higher again this week as tensions around the Strait of Hormuz raised concerns about global energy supplies.
Higher energy prices create a difficult tradeoff. They can reduce purchasing power by raising transportation and utility costs while simultaneously adding to inflationary pressure. That complicates matters for the Federal Reserve. Minutes from the July meeting showed policymakers remain focused on inflation, with some officials open to additional tightening if price pressures fail to improve.
Why it matters: Softer consumer data would ordinarily strengthen the argument for lower interest rates. Persistent inflation and rising energy prices make that decision more complicated and could limit how quickly the Fed is able to respond to weaker growth.
Long-Term Yields Send a Different Signal Than Growth Data
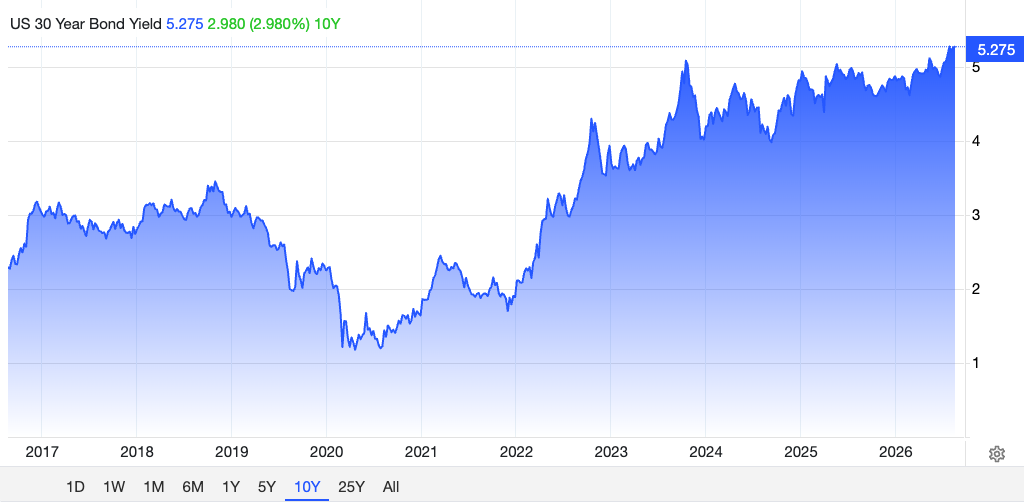
The 30-year Treasury yield rose above 5.30% this week, its highest level since 2007, even as consumer spending and sentiment showed signs of weakening.
That is not the relationship investors would normally expect. When growth slows, investors often move toward Treasuries, pushing prices higher and yields lower. Instead, long-term yields remain under upward pressure as investors weigh persistent inflation against the large amount of government borrowing that needs to be financed.
Why it matters: Longer-maturity Treasuries have historically provided diversification when growth weakens and stocks come under pressure. If long-term yields stay elevated despite softer growth, that relationship may prove less reliable, at least in the near term.
Higher Rates Are Feeding Equity Volatility
The rise in Treasury yields created a more challenging backdrop for equities this week, particularly for higher-valuation areas of the market.
The mechanics are straightforward. As bond yields rise, investors can earn more from comparatively lower-risk assets, which raises the return stocks must offer to stay attractive and can pressure equity valuations. Higher-growth companies tend to be especially sensitive, because more of their expected value depends on earnings further into the future. Stocks have stayed relatively resilient despite the climb in rates, but this week showed that higher yields can still produce bouts of volatility.
Why it matters: Higher interest rates are a potential headwind for stocks, but not the only factor driving market direction. Earnings growth, economic conditions, and investor expectations will ultimately determine whether higher yields become a lasting problem or simply another source of near-term volatility.

The Tax Cost of Retiring Without a Retirement Income Map
You can have more than enough money to retire and still pay more in taxes than you expected.
The problem often isn't how much you've saved. Instead, it's how you decide to turn those savings into income.
During your working years, that decision was mostly made for you. Your paycheck arrived, taxes were withheld, and the remaining money funded your lifestyle.
Retirement changes that.
Now, you may have a traditional IRA, a taxable investment account, Roth assets, cash reserves, Social Security, a pension, and perhaps other sources of income available to you. The question is no longer simply whether you have enough.
You have to decide which dollars should fund each year of retirement.
And that's where tax planning and financial planning begin to overlap.
Retirement income shouldn't be pulled randomly from whichever account is most convenient. Before the paycheck stops, you need a retirement income map that shows where your cash flow will come from, when you'll take it, and what each decision may do to the rest of your financial plan.
Your Accounts Don't All Spend the Same on Your Tax Return
At first glance, a dollar is a dollar.
If you need $200,000 from your portfolio this year, you might assume it doesn't particularly matter whether the money comes from an IRA, a brokerage account, cash, or a Roth IRA.
But the tax return sees those dollars differently.
Generally, taxable distributions from a traditional IRA are included in ordinary income. Meanwhile, when you sell an investment in a taxable brokerage account, you're generally taxed on the gain relative to your adjusted cost basis rather than simply on the entire amount of cash you receive. Qualified Roth IRA distributions generally aren't included in taxable income.
Pension income can create another layer. Depending on how the pension was funded, payments may be fully taxable or may include a nontaxable return of after-tax contributions.
Then there's Social Security.
Depending on your other income, as much as 85% of your Social Security benefits can become included in taxable income. That doesn't mean you're paying an 85% tax rate on Social Security. Instead, it means other income can cause a greater portion of the benefit to become subject to federal income tax.
For retirees on Medicare, higher income can have another consequence. Modified adjusted gross income is also used to determine whether Medicare's income-related monthly adjustment amount, or IRMAA, applies to Part B and Part D premiums. In general, those calculations rely on tax-return information from two years earlier.
So, one large IRA withdrawal may do more than create taxable income.
It can affect the taxation of Social Security. It can influence Medicare premiums in a future year. It can change the tax treatment of investment income. And, depending on what you don't withdraw today, it can influence the size of future required distributions from tax-deferred accounts.
That's why I don't think retirement-income planning should begin with the question, "Which account has the money?"
The better question is, "What income do we want to create this year, and which accounts should create it?"
Consider a Couple With $5 Million Saved for Retirement
Imagine a recently retired couple in their late sixties with approximately $5.2 million in investable assets.
They have $3.1 million in traditional IRAs and retirement accounts, $1.3 million in a taxable investment portfolio, $500,000 in Roth accounts, and $300,000 in cash and short-term reserves.
Between Social Security and a small pension, they receive roughly $100,000 of annual income. However, their lifestyle, travel, charitable giving, family support, taxes, and other expenses require another $200,000 from their portfolio.
That's a much more realistic retirement-income question for a high-net-worth household.
They need $200,000.
Where should it come from?
The simplest answer might be the IRA.
After all, that's what the IRA was built for. So, they could call their custodian, withdraw $200,000, have taxes withheld, and move on.
Operationally, that works.
From a planning perspective, however, we haven't answered nearly enough questions.
Assuming the entire distribution is taxable, that $200,000 IRA withdrawal would add substantially more ordinary income to their tax return. It may also cause more of their Social Security benefits to become taxable and could affect future Medicare premiums.
Now consider that their taxable investment account contains securities with significant cost basis.
Instead of taking the entire $200,000 from the IRA, perhaps the retirement income map calls for $90,000 from the IRA, $80,000 from selected taxable investments, and $30,000 from existing cash reserves.
They still receive the same $200,000 needed to fund their lifestyle.
However, the tax result could be very different.
The $80,000 brokerage withdrawal isn't automatically $80,000 of taxable income. If, for example, the investments sold have a relatively high cost basis, only the realized gain is generally considered when calculating the capital gain from the sale.
Meanwhile, the cash reserve itself doesn't create income simply because it's transferred from a savings account into checking, although interest earned on that cash may already be taxable.
The important point isn't that this particular combination is the "right" answer.
It may not be.
The point is that the decision should be intentional.
Sometimes the Right Answer Is to Pay More Tax Today
This is also where retirement-income planning can easily become too simplistic.
If the goal were merely to minimize this year's taxable income, you could conclude that retirees should avoid traditional IRA distributions whenever cash, high-basis investments, or qualified Roth distributions are available.
I don't think that's the right way to look at it.
Sometimes intentionally creating taxable income today can improve the long-term plan.
For example, the years after retirement but before required minimum distributions begin may give a household more control over its taxable income than it will have later. If most of a couple's wealth is sitting inside traditional retirement accounts, taking additional distributions or completing Roth conversions during lower-income years may reduce the amount left in those accounts later.
So, the goal of a retirement income map isn't necessarily to pay the least tax this year.
The goal is to make informed decisions about when the family pays tax, which assets create the tax, and how today's decision affects the years ahead.
That's an important distinction.
Tax minimization looks at one return.
Retirement-income planning looks at the timeline.
A Retirement Income Map Connects the Years
When we think about retirement planning, it's tempting to divide everything into separate decisions.
When should I claim Social Security?
How much should I take from my IRA?
Should I sell investments from my brokerage account?
Should I convert money to a Roth?
How much cash should I keep?
Individually, those are reasonable questions.
However, they're really pieces of the same decision.
A retirement income map brings them together.
Before retirement, I want that retirement income map to show what the household expects to spend, which income sources turn on automatically, which sources we control, how much taxable income we're intentionally creating, and what the decision may mean several years down the road.
For example, one year may call for heavier taxable-account withdrawals.
Another may be an attractive year to recognize more IRA income.
Another may offer room for a Roth conversion.
Later, Social Security, pensions, required distributions, or other income sources may reduce that flexibility.
The strategy can also change as tax laws, portfolio values, spending needs, and family circumstances change.
That's why a retirement income map isn't a one-time withdrawal schedule.
It's a framework for making better annual decisions.
The Details Matter
This is also where experience and careful tax analysis matter.
Not every traditional IRA dollar is necessarily taxable if the account owner has nondeductible basis. Not every brokerage withdrawal creates the same capital gain because cost basis and holding periods differ. Pension taxation can vary depending on after-tax contributions. Capital losses may offset certain gains. State taxation may differ from the federal rules discussed here.
That's why broad rules of thumb such as "spend taxable accounts first" or "always delay IRA withdrawals" can be misleading.
There isn't one universally correct withdrawal order.
The right sequence depends on the household's balance sheet, tax return, age, income sources, spending needs, estate goals, and what you're trying to accomplish over the next several years.
That coordination is the work.
Build the Retirement Income Map Before You Need the Money
Retirement shouldn't begin with a series of disconnected withdrawal decisions.
If you wait until you need cash and simply pull money from whichever account is easiest, you're allowing convenience to make a tax decision for you.
Instead, start before retirement.
Look at the next several years. Identify the income that will arrive automatically. Estimate the cash flow you'll need from your portfolio. Then determine which accounts can provide that money and how those withdrawals may affect the rest of the plan.
Some years, the answer may be the IRA.
Other years, it may be the brokerage account, cash reserves, Roth assets, or a combination of several sources.
What matters is that you've made the decision deliberately.
Because once you retire, your portfolio isn't simply a collection of accounts anymore.
It's your paycheck.
And if you're going to be responsible for creating that paycheck for the next 20 or 30 years, you should know where each year's income is coming from before you spend it.
That's the purpose of a retirement income map.
Sources
Internal Revenue Service, Publication 590-B: Distributions from Individual Retirement Arrangements (IRAs);
https://www.irs.gov/publications/p590b
Internal Revenue Service, Publication 915: Social Security and Equivalent Railroad Retirement Benefits;
https://www.irs.gov/publications/p915
Internal Revenue Service, Topic No. 409: Capital Gains and Losses;
https://www.irs.gov/taxtopics/tc409
Internal Revenue Service, Publication 575: Pension and Annuity Income;
https://www.irs.gov/publications/p575
Social Security Administration, Modified Adjusted Gross Income and Medicare IRMAA;
https://secure.ssa.gov/poms.nsf/lnx/0601101010
Weekly Market Update: Long-Term Yields Climb as Tech Leads
Markets were mixed this week as gains in large-cap technology stocks offset broader market weakness, while long-term Treasury yields rose sharply.
The S&P 500 gained 0.9% and the Nasdaq rose 3.5%, while the Russell 2000 small-cap index fell -1.3%. Growth 2.5% outperformed Value -0.7%, and the Equal-Weight S&P 500 declined -1.0%, signaling narrow leadership.
Technology led all sectors with a 3.6% return, while Utilities -4.4%, Energy -2.3%, Financials -2.1%, and Real Estate -1.8% lagged the market.
Bonds declined as Treasury yields rose across the yield curve, with long-maturity Treasuries falling -2.8% and investment-grade bonds declining -1.9%. The U.S. dollar strengthened 1.0% as rates rose, oil declined -2.0% despite intra-week volatility, and Bitcoin gained 10%.
Key Takeaways
Consumer Sentiment Nears Its Record Low
The preliminary University of Michigan Consumer Sentiment Index fell to 47.8 from 51.7, moving back toward the record low set in May. Consumers grew notably less optimistic about their personal finances and future business conditions, and one-year inflation expectations rose to 4.6% as higher fuel prices and trade-related concerns added to worries about household costs.
The weaker sentiment contrasts with recent data showing that consumers continue to spend despite a more cautious mood.
Why it matters: Consumers remain active, but they're increasingly concerned about inflation, borrowing costs, and the outlook for their finances and the broader economy.
Long-Term Yields Keep Climbing
The 10-year Treasury yield approached 5.15%, its highest level since 2007, while the 30-year climbed above 5.40%, its highest since 2004. Several factors contributed to the continued rise, including stronger economic data, persistent inflation pressure, higher oil prices, and heavy Treasury issuance.
Why it matters: The move is notable not just because yields are high, but because of how fast they've risen. The faster rates move, the more quickly markets have to adjust expectations for economic growth, inflation, and borrowing costs, which can increase volatility.
Business Activity Picks Up, Price Pressures Persist
The preliminary S&P Global U.S. Composite Purchasing Managers Index rose to 58.4 in September from 56.0 in August, well above expectations and its strongest reading since 2021. Businesses reported the fastest hiring in more than four years, while input costs rose at their quickest pace in four years. The index is based on a survey of businesses rather than hard economic data, but it provides an early read on how activity is changing.
Why it matters: The survey suggests economic activity remains solid. The combination of firm activity and persistent price pressures is contributing to higher Treasury yields and reinforcing expectations that the Fed may need to keep rates elevated or tighten further.
Meta's Muse Lifts AI, Weighs on Consumer Businesses
Muse, Meta's new personal AI agent, surpassed ChatGPT to become the top free app in the U.S. Meta shares rose sharply, the Nasdaq set a new all-time high, and semiconductor stocks rallied as investors considered how AI agents could increase demand for computing power.
The launch also pressured travel, financial, insurance, and other consumer-facing stocks, as investors questioned whether AI agents could make it easier for customers to compare prices, negotiate bills, and switch providers.
Why it matters: Strong early adoption reinforces the case for continued demand for AI infrastructure, but the reaction across travel, financials, and other industries shows that investors are still determining who ultimately benefits and who faces disruption.